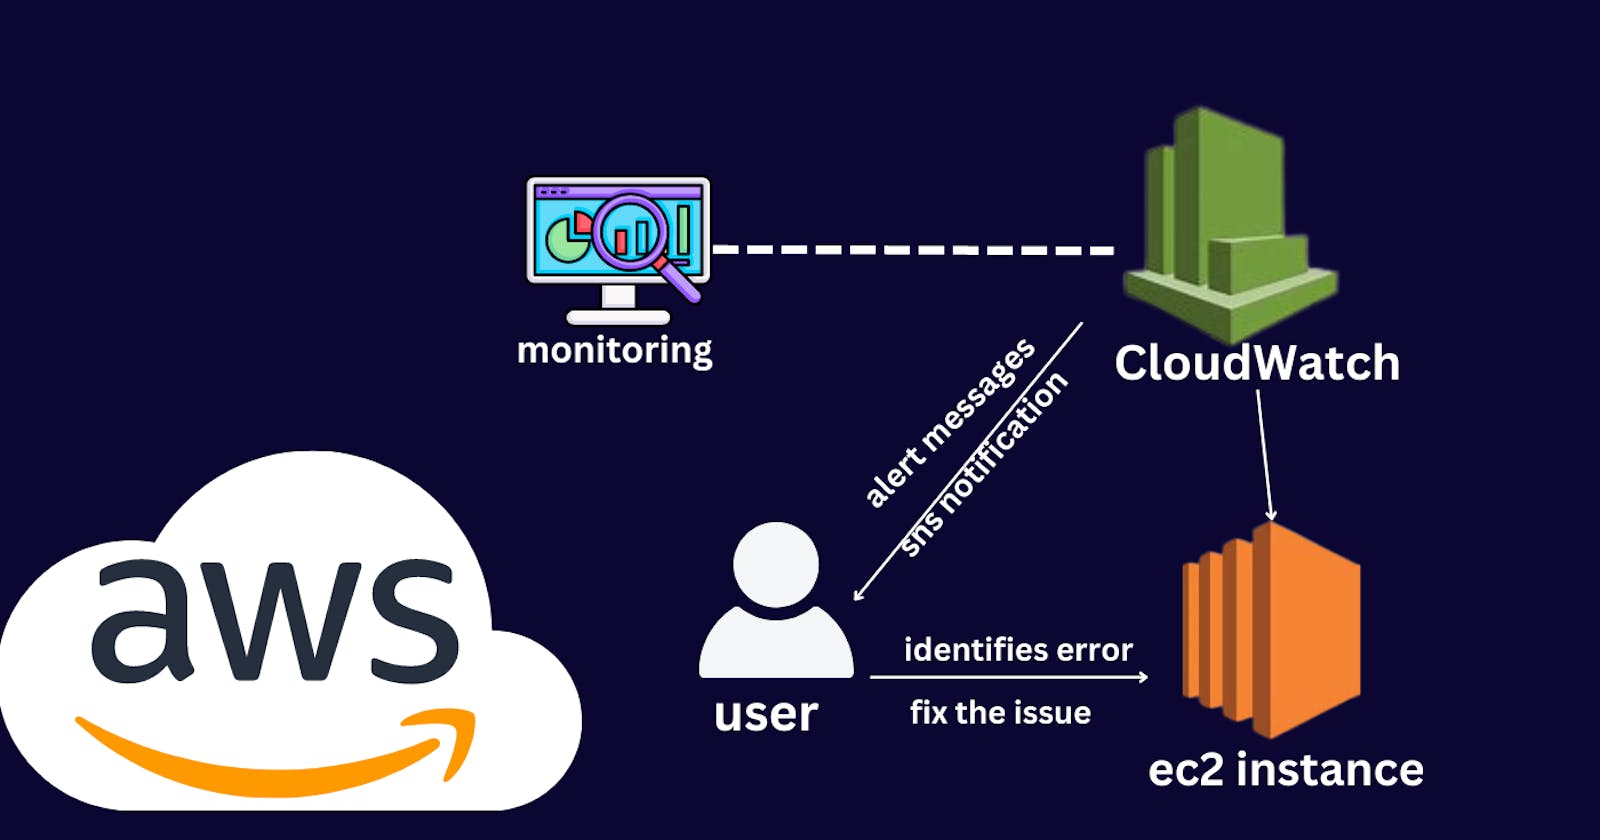
Subash Neupanesubashneupane7.hashnode.dev·Jan 19, 2024Unleashing the Power of AWS CloudWatch for Optimal Resource ManagementIn this blog, we will deep dive into one of the important services offered by Amazon Web Services (AWS) – CloudWatch. As businesses increasingly migrate to the cloud, effective monitoring and management become crucial. AWS CloudWatch emerges as a smo...DiscussAWS
Pankaj Suryavanshidevtestops.hashnode.dev·Jan 5, 2024Handling Java Alerts using Selenium WebdriverUnderstanding Java Alerts 🤔 Java Alerts are used to convey important information, warnings, or prompt user interaction. They can appear as simple informational messages, confirmations, or input prompts. Types of Java Alerts: Alerts: Simple notifica...DiscussSelenium Javaselenium
Mahira Technology Private LimitedPromahiratechnology.hashnode.dev·Dec 11, 2023Mastering Alert Rules in Grafana Dashboards: A Comprehensive GuideIntroduction :- Alerting is a crucial component of any #monitoring system, and #Grafana has emerged as a popular choice for creating visually appealing and informative dashboards. But what truly sets #Grafana apart is its robust alerting system, whic...Discuss·52 readsGrafana
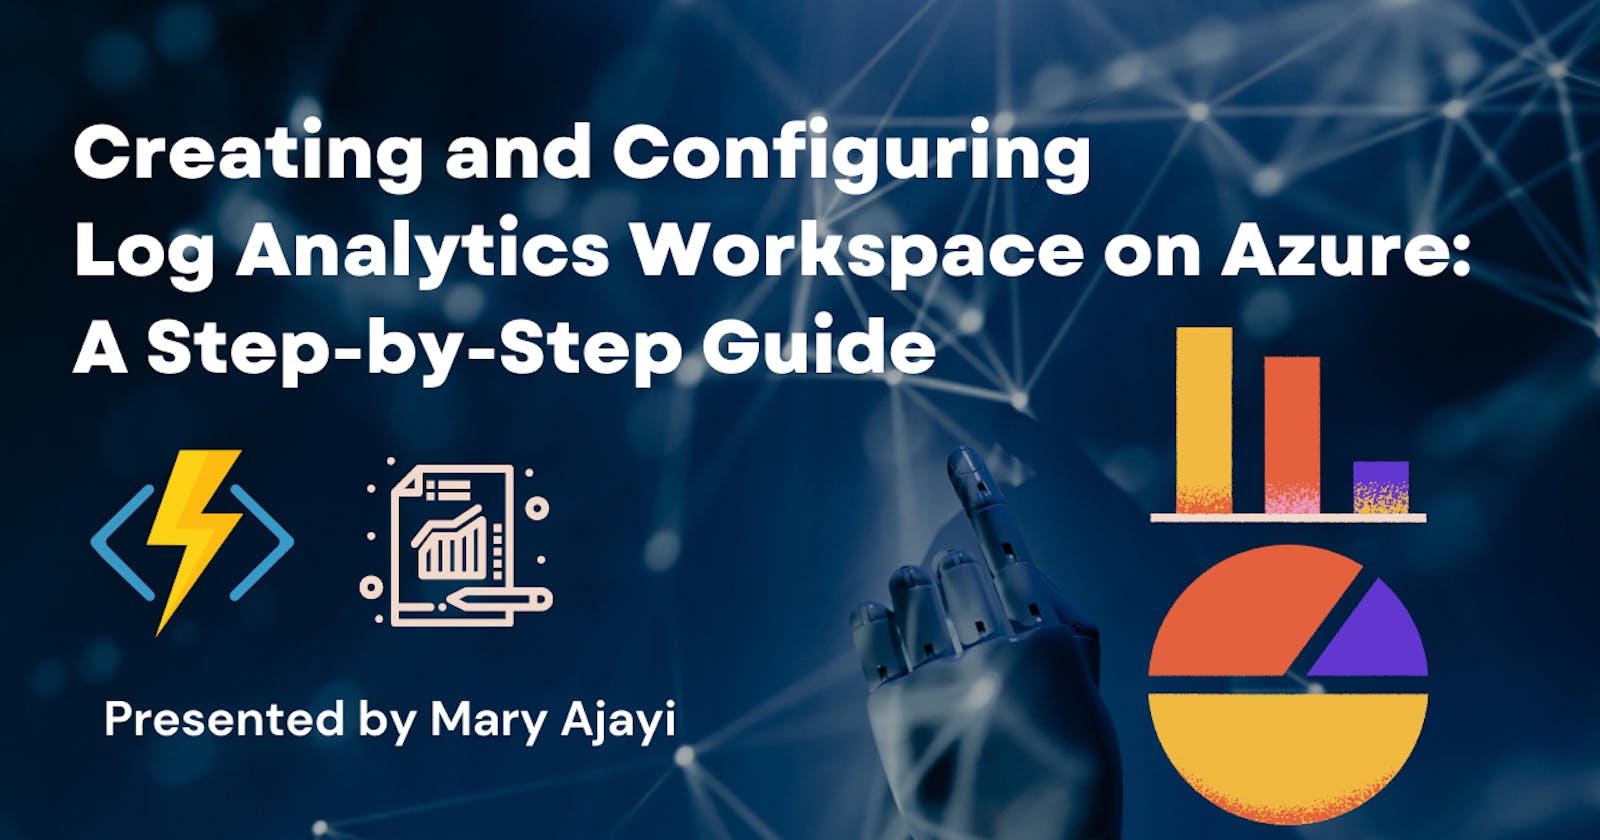
Mary Ajayiyourtechie.hashnode.dev·Dec 7, 2023Step-by-Step Guide to Creating and Configuring a Log Analytics Workspace on AzureAzure Monitor Logs Azure Monitor Logs is a part of Azure Monitor that gathers and arranges log and performance information from the resources you're monitoring. A Log Analytics workspace is a special space for log data from Azure Monitor and other Az...Discuss·32 readsAzure
Derek Onwudiwetecheffect.hashnode.dev·Aug 16, 2023Demystifying Penetration Testing: Safeguarding Your Digital Assetsdetailed breakdown of each step in the penetration testing process along with their explanations: Information Gathering: In this phase, the penetration tester collects as much information as possible about the target system or network. This can inclu...Discusspenetration testing
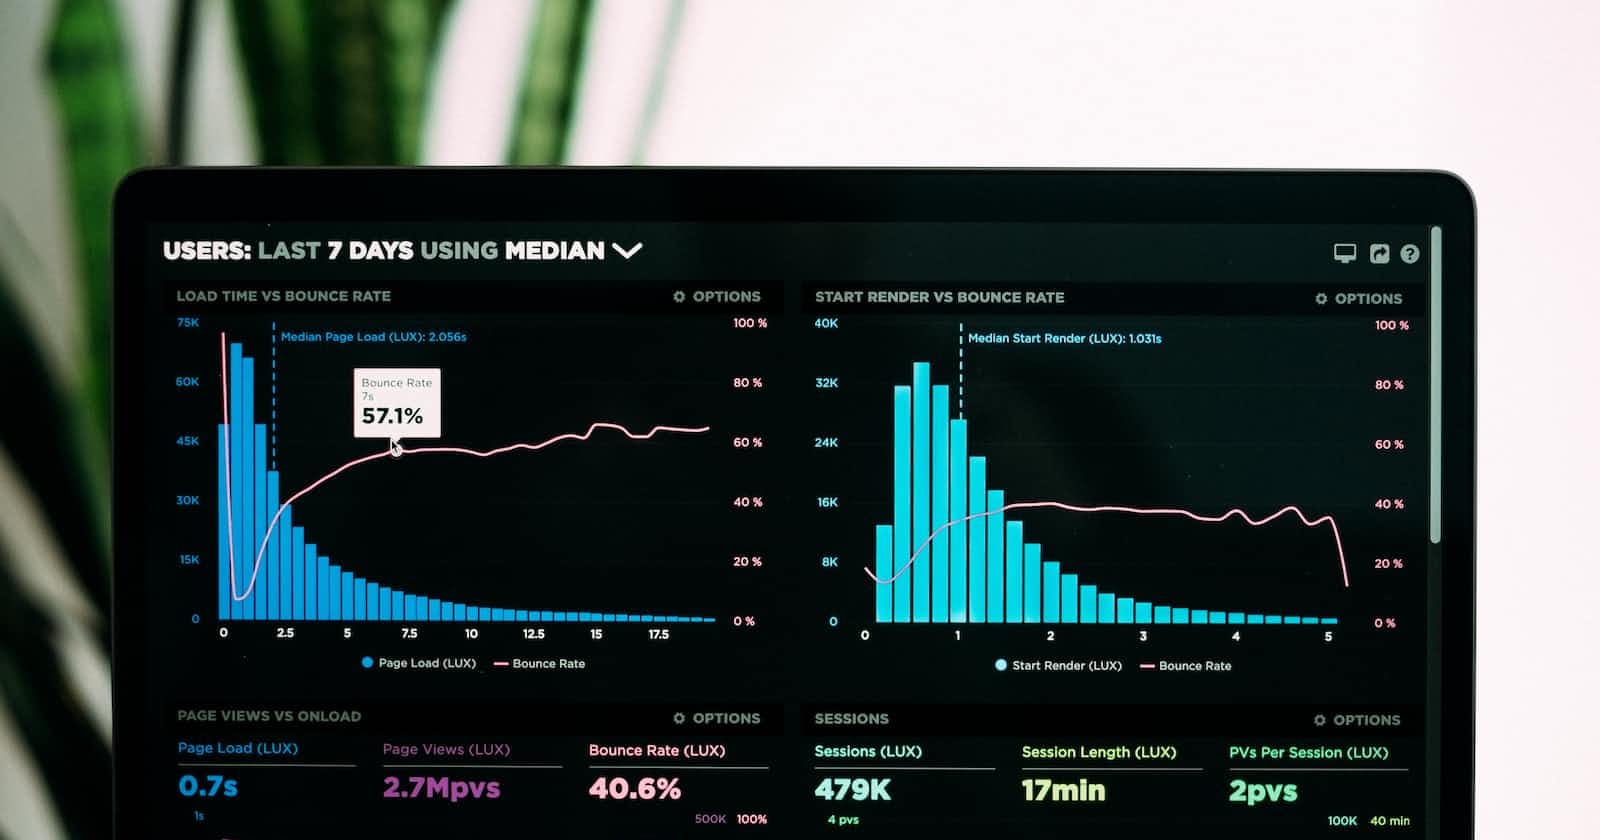
sumit sharmasumit701.hashnode.dev·Jul 21, 2023Monitoring servers with Prometheus, Node Exporter, Grafana and AlertmanagerEvery organization wants its application and resources always up and running. For that, we must monitor our resources and applications. For a large organization where resources are the least in numbers, we can monitor manually, but in bigger organiza...Discussinfrastructure
jorzeljorzel.hashnode.dev·May 10, 2023How to build an alerting system with Prometheus and AlertmanagerIntroduction While Prometheus is excellent at collecting and storing metrics, it does not provide a built-in mechanism for alert notifications. This is where Alertmanager comes in. Alertmanager is a component of the Prometheus ecosystem that manages ...Discuss·1 like·528 readsObservability guideDevops
Rakesh Darged365cliffsnotes.com·Apr 12, 2023Dual-write: Types of Errors and How to Fix themOops…there’s an Error! :) 😬 While using Dual-write infrastructure we encounter a wide variety of different types of errors. Often, these errors leave us scratching our heads. Nevertheless, we can learn what those errors mean by understanding why we ...Discuss·636 reads#dynamics365
Xavierxavier7t.com·Mar 29, 2023Alert in SwiftUIIn any application, it is important to notify the user of important information or errors. One way to achieve this in a SwiftUI application is through the use of an Alert view. An Alert is a view that pops up over the main view of the application to ...Discuss·143 readsiOS
Bawantha Wickramarachchibawanthaw.hashnode.dev·Mar 14, 2023How to set up alert metrics on GCP for disk utilization?As a DevOps Engineer, one of the most critical tasks is to ensure that the infrastructure is running optimally. In order to achieve this, monitoring disk utilization is a vital aspect. Fortunately, Google Cloud Platform (GCP) provides us with an easy...Discuss·151 readsGoogle Cloud Platform