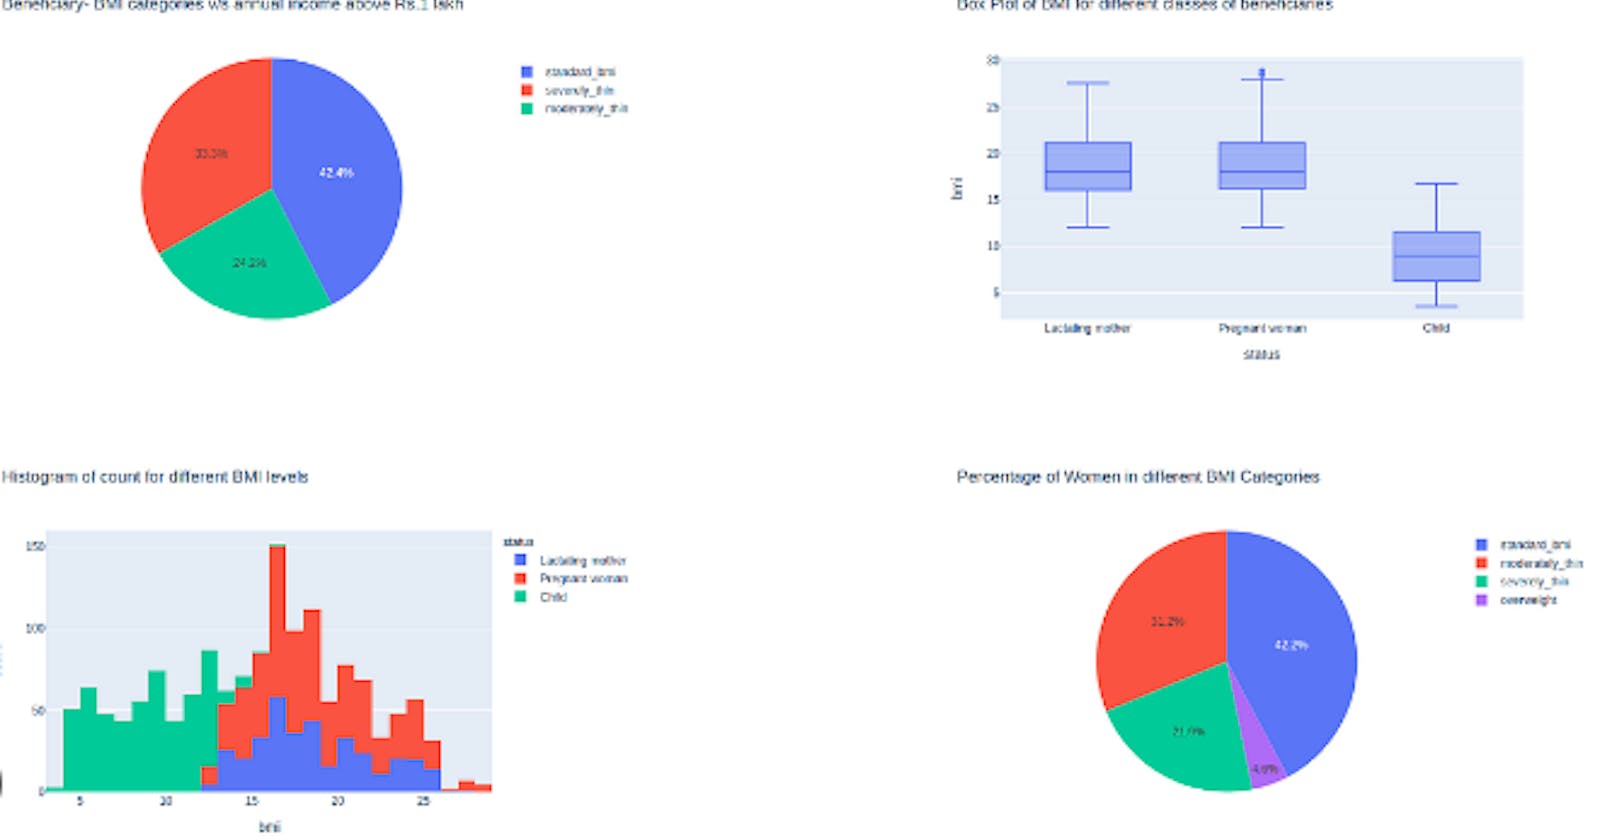
Sebastian Rodrigo ARCE BRACAMONTEsrarceb.hashnode.dev·Apr 20, 2024Dash: Web applications with PythonWhat is Dash? Dash is a Python framework used to create interactive web applications and data analytics. It is built on top of Flask, Plotly.js, and React.js, allowing developers to create complete web applications using only Python. Main Features Py...DiscussPython
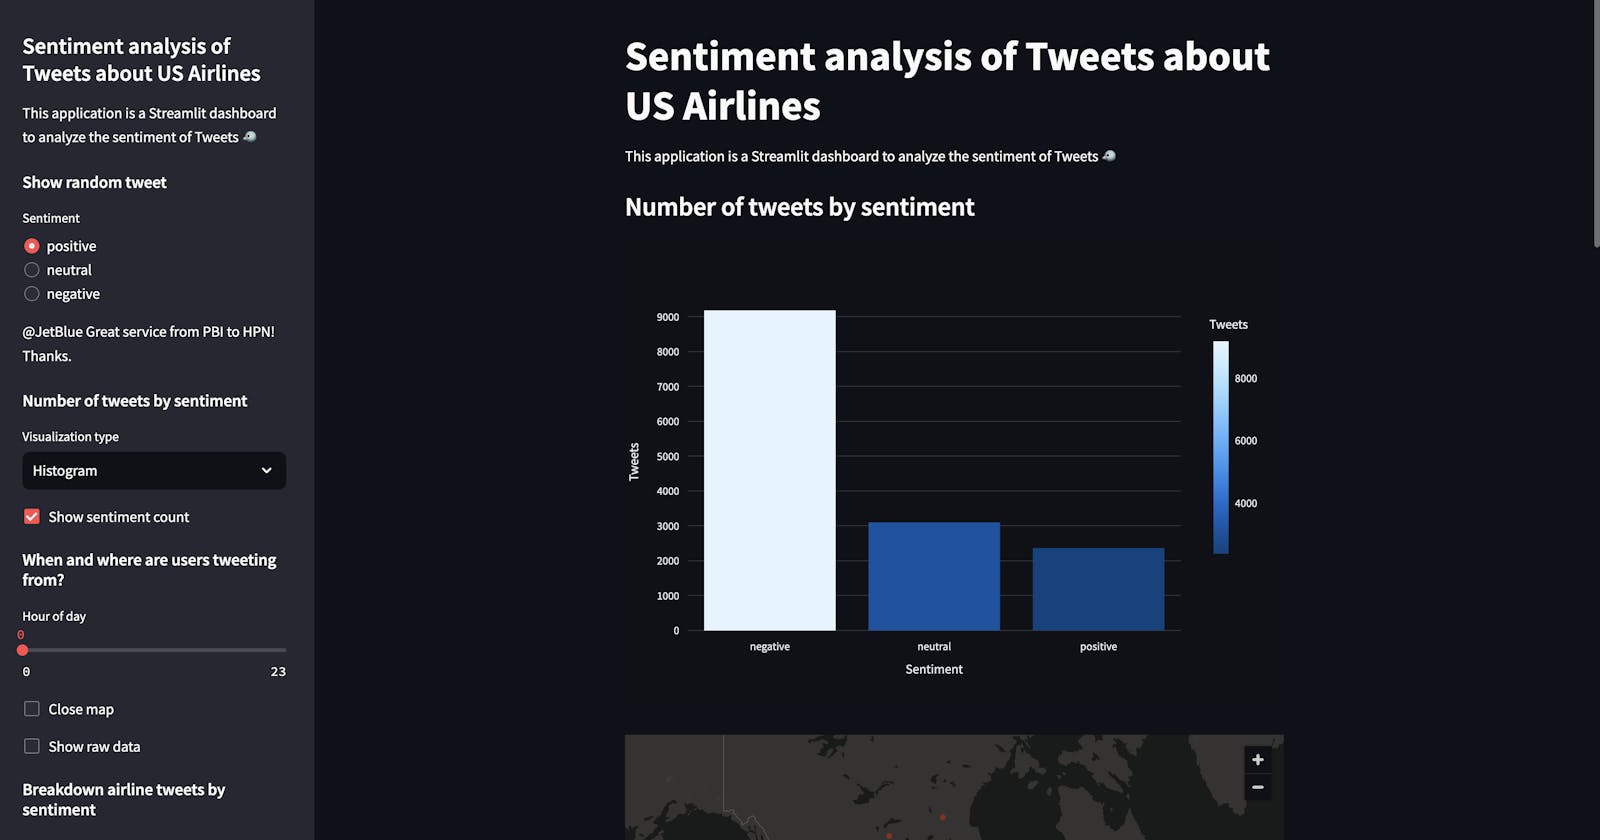
Arya singharyasingh.hashnode.dev·Apr 16, 2024Harnessing Twitter Sentiment Analysis for US Airlines: A Streamlit Dashboard ExplorationIntroduction: In today's digital age, social media platforms like Twitter are goldmines of consumer sentiment. This blog explores our latest project: a Streamlit dashboard designed to analyze and visualize sentiments from tweets about US airlines. By...DiscussPython
Tyler Wellsblog.skeego.com·Apr 3, 2024I know the customer-facing dashboard you want to buildI know the customer-facing dashboard you want to build. I know that your customers have asked for it. It's been on your roadmap for at least a quarter or more. The dashboard you want to build contains four KPIs in four boxes across the top of the scr...DiscussDeveloper
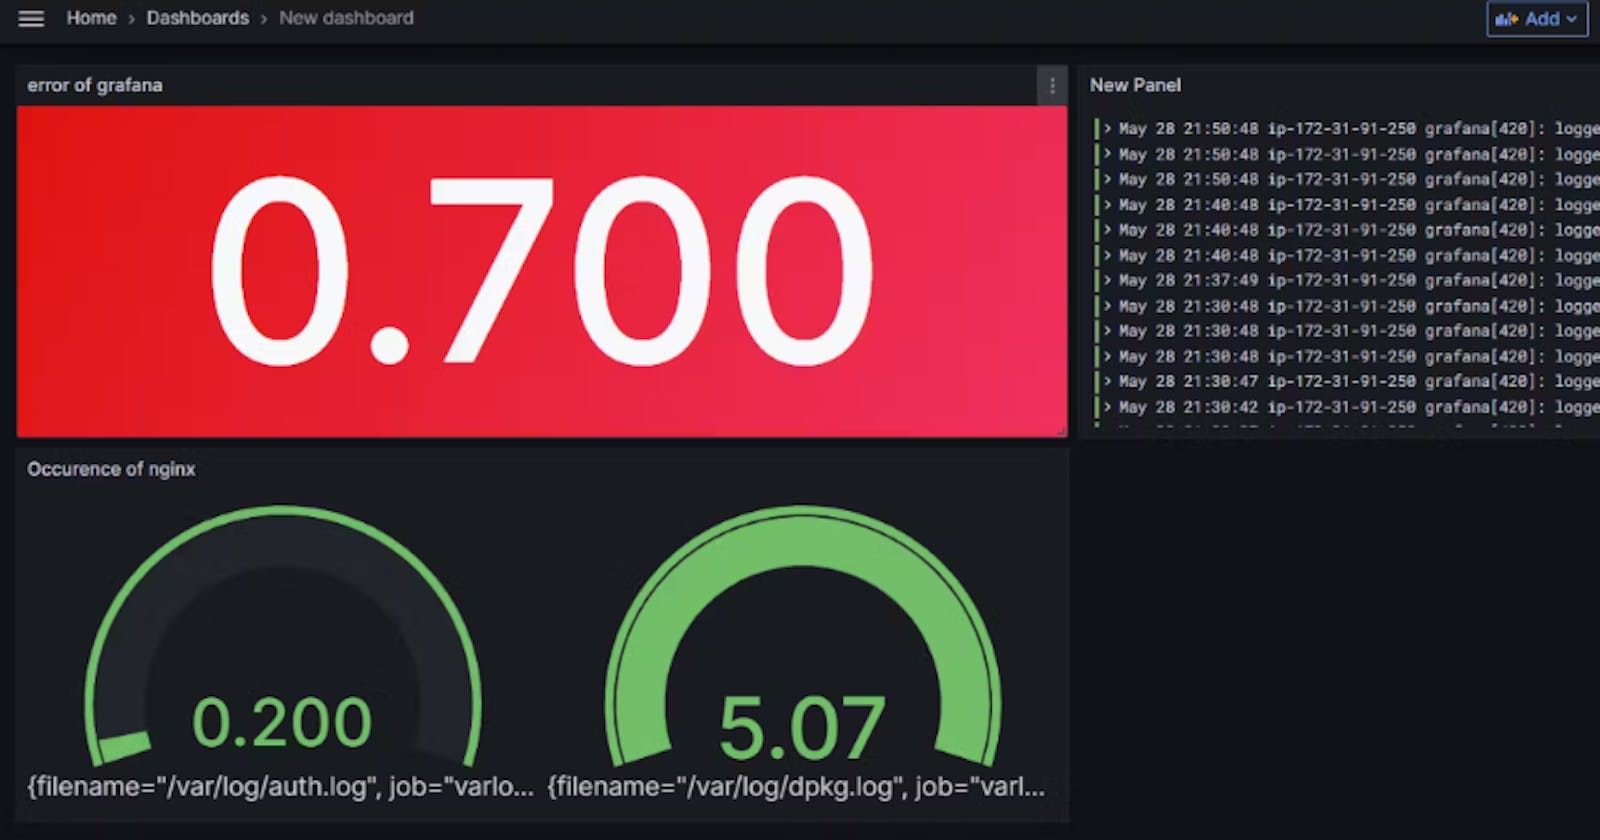
Davender Singhdavender.hashnode.dev·Mar 22, 2024Day 76 - Build a Grafana Dashboard 📊Hey everyone! Today, we're diving into the exciting world of Grafana dashboards. Dashboards are like the command centers of your monitoring setup, offering a visual snapshot of your data and metrics. Let's roll up our sleeves and start crafting our o...Discuss90DaysOfDevOpsday76
Dominik KellerforLow-Code Software Engineeringfive.hashnode.dev·Mar 17, 2024Code-Along: How to Develop a REST API DashboardHi and welcome to our step-by-step guide on building your first web app with Five. Follow the steps below to build a responsive web app with a dashboard that visualizes data coming from a REST API in Five. Goals and Outcomes By the end of this step-b...DiscussREST API
Nikita ShindeforTechNerdZtechnerdz.hashnode.dev·Mar 17, 2024Cluster Monitoring using Prometheus & GrafanaHi There, Ever wondered how you can effortlessly spot problems in your cluster without constantly checking every component? Welcome to a simpler way of keeping an eye on things! In this blog, we'll explore how using Prometheus and Grafana can make mo...Discuss·1 like·70 readsKubernetes
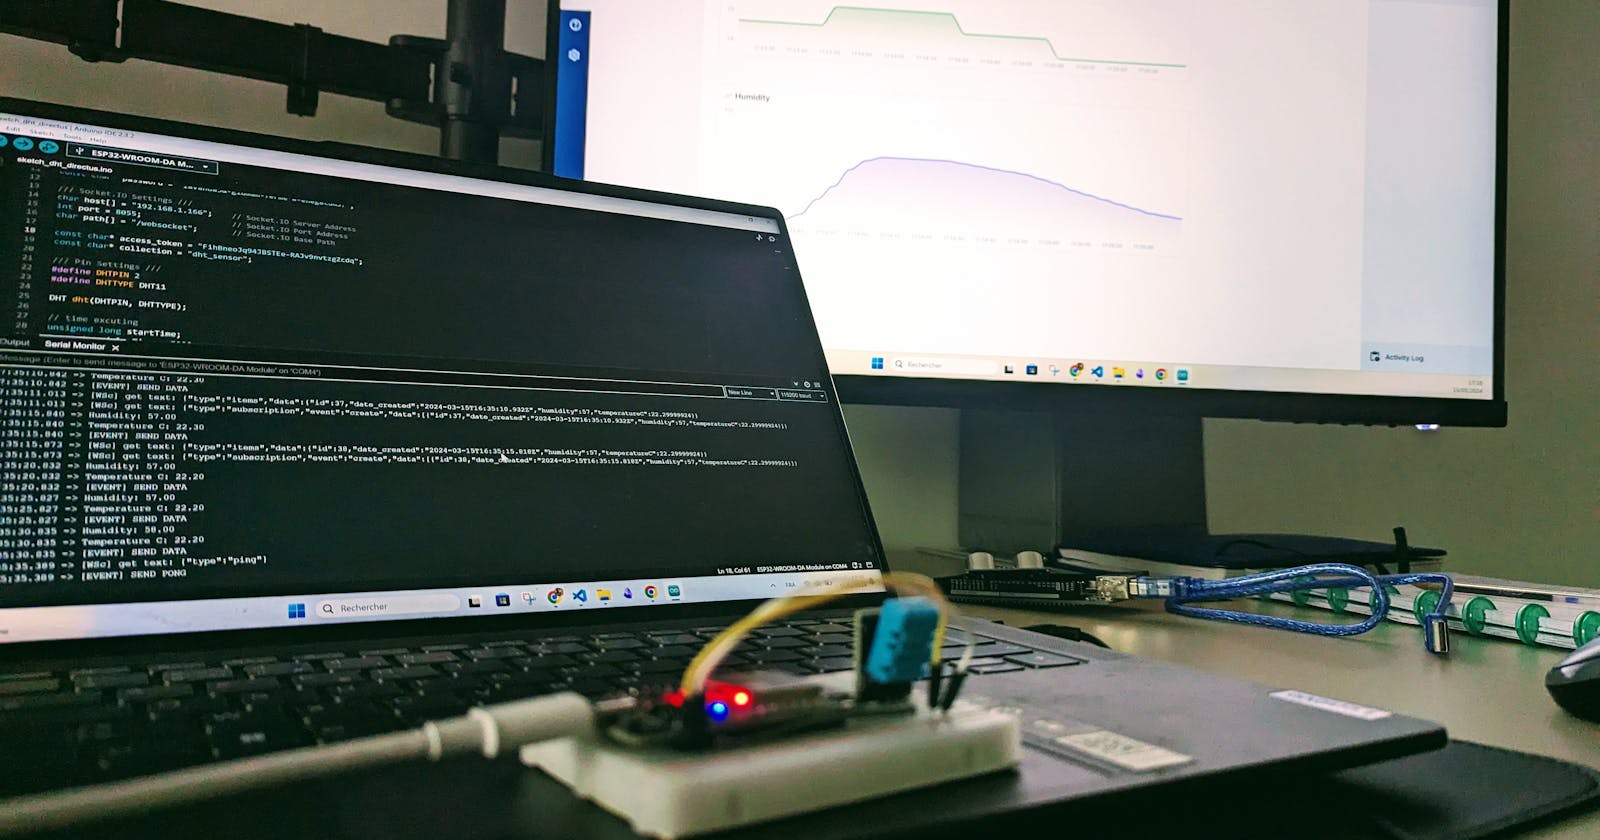
Ayoub ToubaforYaffaLabblog.yaffalab.com·Mar 16, 2024ESP32/Arduino Sensor Data Visualization on Web Apps: A Beginner's Guide with Directus: Part 1Ever wanted to build a project that bridges the physical world with the web, but coding a web application seems daunting? This guide is for you! We'll embark on a journey to create a system that collects sensor data and displays it on a user-friendly...Discuss·1 like·40 readsESP32
Luca Liuluca1iu.hashnode.dev·Mar 7, 2024Power BI: How to Create Dynamic Show Hide Slicer PanelIntroduction: Optimizing space and enhancing usability are vital aspects of designing Power BI dashboards. In this article, we'll explore a versatile technique for creating a Dynamic Show Hide Slicer Panel in Power BI. This technique allows users to ...DiscussPowerBI
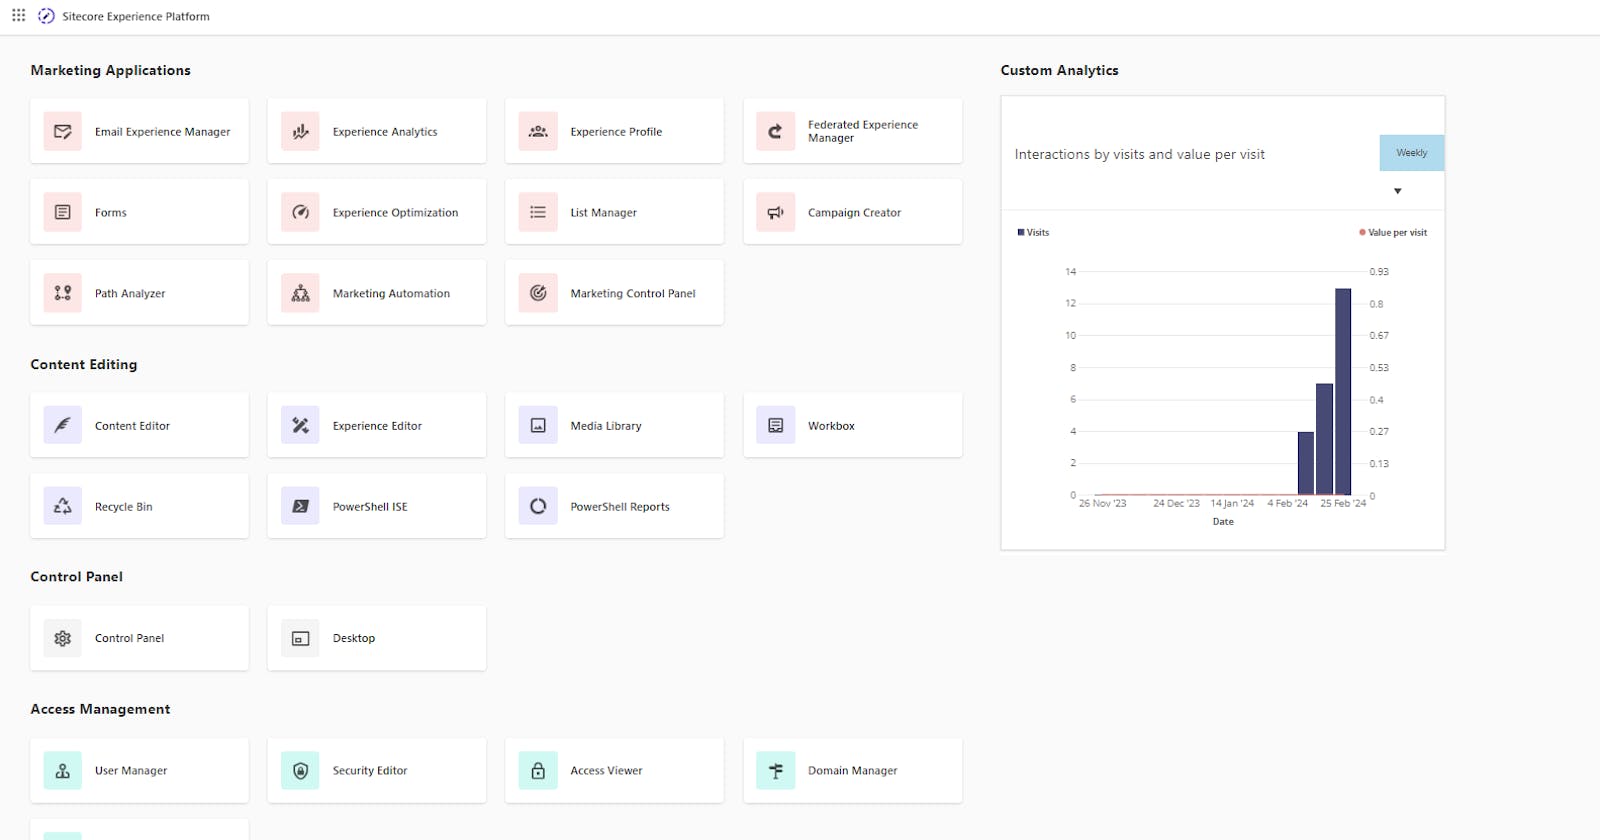
Dev Kheradiyadevkheradiya.hashnode.dev·Mar 1, 2024Sitecore Dashboard: Your Definitive Guide for BeginnersIn my previous blog, you gained knowledge about what a CMS is and what Sitecore is. So, in this blog, we will understand the different features that are present in the Sitecore dashboard. Above is an image of the Sitecore dashboard, which includes fi...Discuss·77 readsSitecoreSitecore
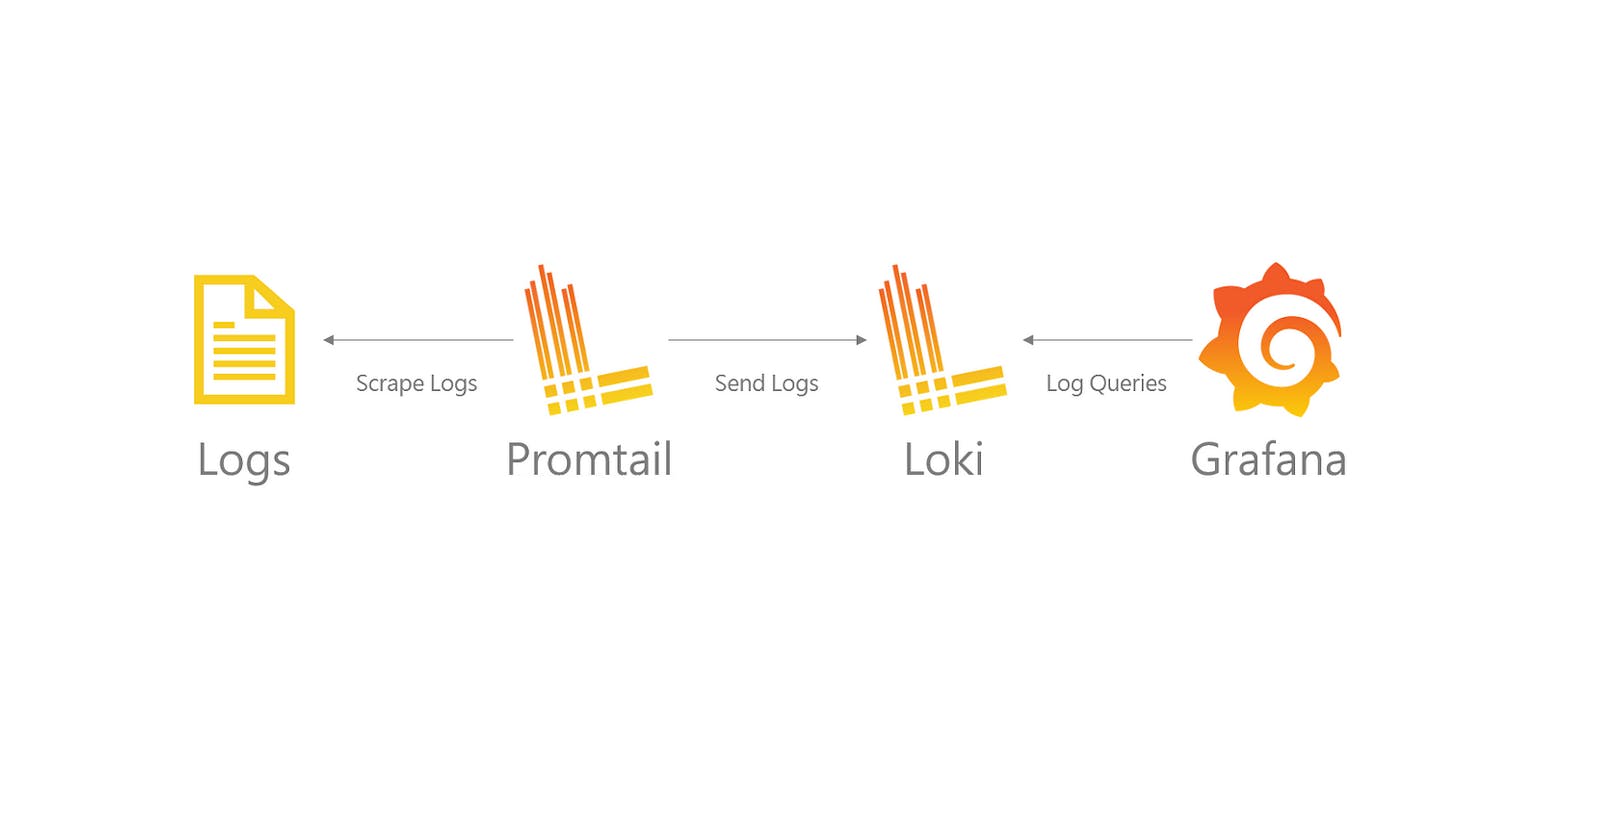
Kshitija Bartakke-Malwadekshitijaa.hashnode.dev·Feb 23, 2024Streamlining Log Monitoring: Building a Dashboard with Grafana, Loki, and PromtailIntroduction: In today's fast-paced digital landscape, effective log monitoring is essential for ensuring the reliability, security, and performance of software applications and infrastructure. Traditionally, managing logs across distributed systems ...Discuss·1 like·135 readsGrafana