


R is not just a statistics package, it’s a flexible and powerful programming language for statistical computing, analysis, and graphics. R can be considered as the lingua franca of data science and is one of the popular language choices to learn data science.
R is great not only for doing statistics but also for many other tasks, including geospatial (GIS) mapping and analysis. R has some awesome packages that make it easy and interesting to work with different formats of spatial data (SHP, GeoJSON, KML etc.).
However, we can take advantage of scripting languages like R to build more customizable GIS applications with capabilities of performing most of the spatial data analysis we used to in existing GIS software.
In this post, I will be sharing some of the R packages I love working within performing Geo-Spatial Analysis and Mapping.
1. Leaflet
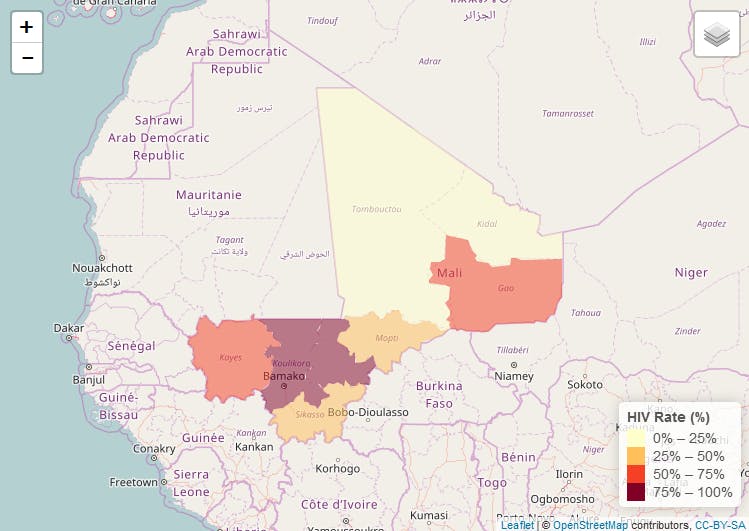
First on my list is the LeafletJS R package. Leaflet is an open-source JavaScript library for building mobile-friendly interactive maps. The Leaflet R package makes it easy to integrate geo-spatial data mapping and visualization functionalities of LeafletJS in R.
## import R packages
library(rgdal)
library(leaflet)
## read shapefile data path = "./data/Mali_ADM.shp"
mali_shp qpal map %
# Base groups
addTiles() %>%
addPolygons(data = mali_shp, stroke = FALSE, fillOpacity = 0.5, color = ~qpal(HIV_Rate_P))
map # Print the map
2. RGdal
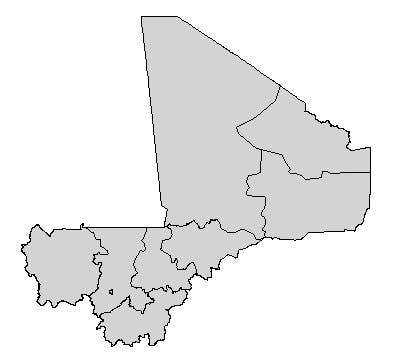
rGDAL is an R package built upon GDAL (Geospatial Data Abstraction Library). GDAL is an open-source software library for reading and writing but raster and vector geospatial data formats. rGDAL makes it easy to work with traditional GIS data formats such as shapefiles in R.
## import R packages
library(rgdal)
## load shapefile data path = "./data/Mali_ADM.shp"
mali_shp plot(mali_shp, col = "lightgrey") ## plot shapefile
3. TMap
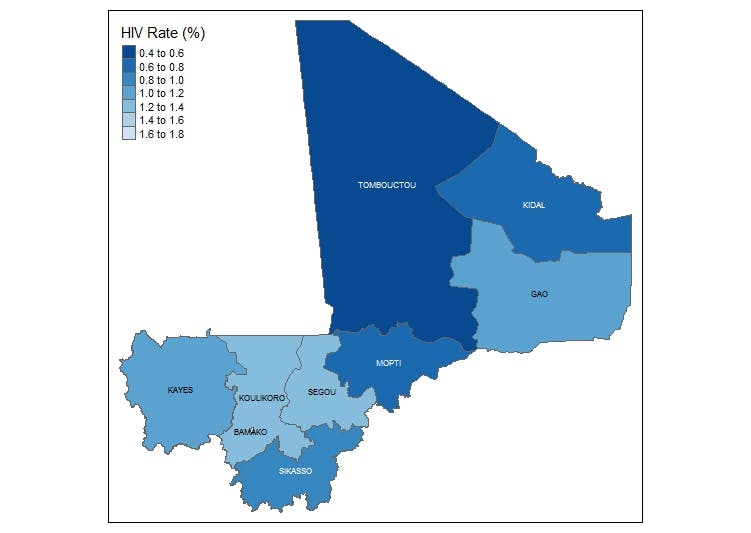
tmap is an R package that allows users to generate thematic maps with great flexibility. The syntax for creating plots is similar to that of ggplot2. The tmap package also contains many facility functions for reading and processing shapefiles.
## import R packages
library(rgdal)
library(tmap)
## read shapefile
## data path = "./data/Mali_ADM.shp"
mali_shp ## tmap allows you to plot thematics maps
qtm(shp = mali_shp, fill = "HIV_Rate_P", fill.palette = "-Blues", fill.title="HIV Rate (%)", text = "REGION_NAM", text.size = 0.5)
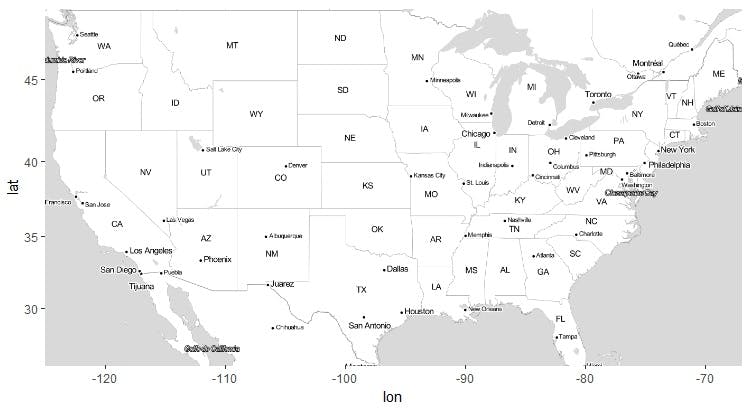
4. GGMap
ggmap makes it easy to retrieve raster map tiles from popular online mapping services like Google Maps, OpenStreetMap, Stamen Maps, CloudMade and plot them using the ggplot2 framework. ggmap can easily be used to create heat-maps by visualizing point related data.
## import library
library(ggmap)
## Plot Map
us
map
ggmap(map)
5. Maptools
Set of tools for manipulating and reading geographic data. The package also provides interface wrappers for packages such as PBSmapping, spatstat, maps, RArcInfo, Stata tmap, WinBUGS, Mondrian, and others. Maptools has a number of functions to explore the spatial relations in data.
The code below is an example showing how R can be used in the visualization of spatial objects.
## import R packages
library(maptools)
## Read shapefile with the maptools package
mali_shp
## plot data to map
plot(mali_shp)