


End to end testing of web applications is pivotal to ensure it’s quality. This is why you need to make sure that all the issues and bugs are addressed. When you encounter issues while testing, the best approach is step by step debugging the code. Debugging can be a great way to ensure that your Selenium automation tests run as intended and there are no false positives or negatives.
In this Protractor tutorial, I’ll get you started on how to debug Protractor tests, which is one of the most popular JavaScript testing frameworks. If you want to learn more about how to write test scripts in Protractor, you can refer to our previous article on cross browser testing with protractor.
What Are The Problems To Debug Protractor tests?
While testing a web application, you’ll often encounter bugs in your code. The quality of certain modules might not be apt or there are browser compatibility testing issues. These bugs are caught while you debug your Protractor tests. You might face a few problems along the way, these are as follow :
- Testing of a web application is tricky due to its dependency on the entire system .
- You’ll require a different WebDrivers for various operating systems and browsers for performing cross browser testing.
- The Selenium test automation scenarios follow a sequence of actions and the output of the current test cases serves as the input of the further test cases and hence there is a dependency.
- The long error messages encountered while performing automation tests might be tough to comprehend.
- It becomes difficult to distinguish between errors and issues which are either related to browsers or test scenario processes.
What Are The Types Of Failures You Need To Debug In Protractor Tests?
There are major types of failure scenarios that are encountered while performing Protractor testing. Below are some of the main reasons for failure:
- Expectation Failure
- WebDriver Failure
- WebDriver Unexpected Failure
- Protractor Angular Failure
- Protractor Timeout Failure
Here I’ll further explain these failures in this Protractor tutorial.
Expectation Failure
This is one of frequently occurring and the most common failures encountered when the normal flow execution of the test fails. This results in an expectation failure.
WebDriver Failure
If we encounter a scenario where an element or attribute is not found or even when there is an uncertainty in the address requested by the browser. This results in a Web Driver failure error as the requested command is not executed by the web driver.
WebDriver Unexpected Failure
If there occurs a scenario where the web driver update is failed, and it results in a sudden browser crash or OS-related failure. This state is known as web driver unexpected failure.
Protractor Angular Failure
The scenario where the Protractor framework is unable to find the required Angular libraries in the module is referred to as Protractor Angular Failure. This type of failure also occurs when the useAllAngular2AppRoots attribute is missing from the configurations and it also causes the test process to expect multiple elements but only processing with the single root element.
Protractor Timeout Failure
When the test suite gets stuck in a loop for a long period of time and as a result, the data is not returned in the speculated time. This type of failure is known as Protractor Timeout Failure.
How To Debug Protractor Tests In Selenium?
Protractor extends the functionality of node debugger used by most of the node js applications to debug Protractor tests. This provides us the flexibility to debug protractor tests by adding additional statements required in the debugging mode from the terminal.
You can debug Protractor tests works is by utilizing the following methods stated in this Protractor tutorial:
- Pause Method
- Debugger Method
- Screen Shot Method
Pause Method To Debug Protractor Tests
The pause method provides the easiest and the most popular ways to debug the protractor tests for Selenium test automation. This can be done by appending the browser.pause() the method at the place where we want to pause our tests and check for errors.
As an example of this Protractor Tutorial, I’ll use the script shown below.
test_debug.js
In the script test_debug.js , I have specified a test scenario where we locate an element in the web application using the locator by.binding() with (‘myTestString’) but the launched URL i.e. (google.com) in the browser does not have the element with the specified locator.
// test_debug.js //
// describing our Selenium test automation scenario for protractor framework //
describe(' Sample Protractor Test Suite for debugging example ',function(){
// information about the test case //
   it('An Example to perform Debug during Testing',function(){
// launching the url in browser  //
      browser.get("http://www.google.com");
      element(by.model('testName')).sendKeys('Test Automation');
         // It performs the check whether the element exist or not //
         var myText = element(by.binding('myTestString')).getText();
         expect('Welcome to '+myText+'!').toEqual('Welcome to Test Automation!')
   });
});
When the script shown above in this Protractor tutorial is executed, this will result in a failure with NoSuchElementError. Hence, in order to find the root cause of the issue, it is necessary to debug the script diligently.
Now, I’ll show you how to use the browser.pause() method to debug this failure for Protractor testing. Before proceeding with the changes, I’ll make necessary changes for the configuration in the test_config.js file as shown below:
test_config.js
This is the configuration file used by protractor for managing any config parameter used globally within the web application.
// test_config.js //
// The test_config.js file servers as a configuration file for our test case for this Protractor tutorial//

// setting required config parameters //
exports.config = {
   directConnect: true,

   // Desired Capabilities that are passed as an argument to the web driver instance.
   capabilities: {
      'browserName': 'chrome'  // name of the browser used to test //
   },

   // Flavour of the framework to be used for our test case //
   framework: 'jasmine',

   // The patterns which are relative to the current working directory when

protractor methods are invoked //

   specs: ['test_debug.js'],
// overriding default value of allScriptsTimeout parameter //
      allScriptsTimeout: 999999,
      jasmineNodeOpts: {
// overriding default value of defaultTimeoutInterval parameter //
      defaultTimeoutInterval: 999999
   },
   onPrepare: function () {
      browser.manage().window().maximize();
      browser.manage().timeouts().implicitlyWait(5000);
   }
};
Please note that we have increased the timeout in the above config file for the parameters all Scripts Timeout and default timeout interval to 999999. By default, the timeout interval set is 11 sec and 30 secs respectively.
Now, for debugging the above Selenium test automatio script I’ll need to update the test_debug.js file to add browser.pause() in the place where we would like to pause our test for debugging i.e. after loading the URL. The updated script looks as below:
// test_debug.js //
// describing our test scenario for protractor framework //
describe(' Sample Protractor Test Suite for debugging example ',function(){
// information about the test case
   it('An Example to perform Debug during Testing',function(){
// launching the url in browser //
      browser.get("http://www.google.com");
      browser.pause();
      element(by.model('testName')).sendKeys('Test Automation');
         // It performs the check whether the element exist or not //
         var myText = element(by.binding('myTestString')).getText();
         expect('Welcome to '+myText+'!').toEqual('Welcome to Test Automation!')
   });
});
To script is executed with the below command which will also start the debugger.
$ protractor test_config.js
Here in the output:
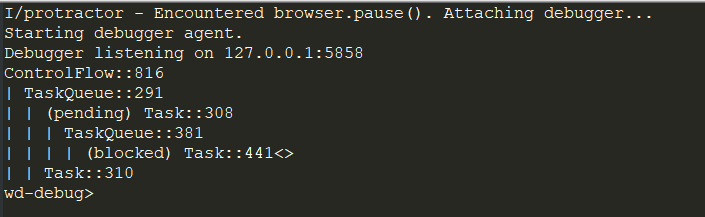
When the above code is executed and the pause command is hit, we can see it pauses the code at that point and the debugger is started after launching the URL in the browser.
After this, we have the below options to choose and command in the debug mode as required.
C: Press the C key and hit enter to move forward in the execution i.e. the next immediate step in the flow is executed by the protractor. If the C is not pressed the test will not move forward halt due to timeout. Also, we can continue using C until a failing statement is encountered.
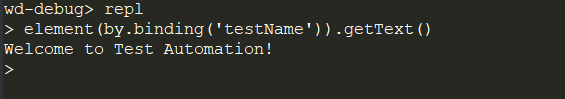
repl: Using repl command in the terminal allows us to enter the interactive mode which is required in order to send out web driver commands to the browser and executes the protractor statements at run time. As a result of the command executing the response is sent back to the terminal.
For example : The issue in the statement that is causing the error in our script is the element (by.binding(‘’myTestString’)).getText(). Therefore, I’ll use the repl to enter the interactive mode and use the correct locator. You can refer to this article on locators in Protractor to know more about how to use locators with Selenium Protractor.
Ctrl + C : In order to exit the test from the pause state you need to type Ctrl + C to resume the test.
Debugger Method To Debug Protractor Tests
The usage of the debugger method to debug the test cases in Protractor is very simple and similar to the one we used with the pause method. You just need to place it at the proper point where we want to add a breakpoint in the code. It can be achieved by using the browser.debugger() as a replacement for browser.pause() in the Selenium test automation script. In order to debug the code, it makes use of the node debugger.
// test_debug.js //
// describing our Selenium test automation scenario for protractor framework //
describe(' Sample Protractor Test Suite for debugging example ',function(){
// information about the test case
   it('An Example to perform Debug during Testing',function(){
// launching the url in browser //
      browser.get("http://www.google.com");
      browser.debugger();
      element(by.model('testName')).sendKeys('Test Automation');
         // It performs the check whether the element exist or not //
         var myText = element(by.binding('myTestString')).getText();
         expect('Welcome to '+myText+'!').toEqual('Welcome to Test Automation!')
   });
});
The protractor testing script is executed with the debug option as shown in the below command. This command will also start the debugger.
$ protractor debug test_config.js
While using the debug method, we can also choose to type C command in the terminal similar to the one used in the pause method for continuing forward in the test code. But unlike the pause method, it can only be used once in case of the debugger method.
Screenshot Method To Debug Protractor Tests
Another exciting way of debugging a test script is by taking a screenshot. We can enable the WebDriver to take a screenshot with browser.takeScreenshot(). This provides a great way to debug tests mainly on the integration servers that continuously execute the tests. This will result in generating a screenshot in PNG format with base 64 encoded.
test_debug.js
// test_debug.js //
// the variable declared at the beginning of the test script:
var myscript = require('fs');

// function that defines how to write screenshot to a file
function writeScreenShot(data, filename) {
    var mystream = myscript.createWriteStream(filename);

    mystream.write(new Buffer(data, 'base64'));
    mystream.end();
}


// describing our test scenario for protractor framework //
describe(' Sample Protractor Test Suite for debugging example ',function(){
// information about the test case
   it('An Example to perform Debug during Testing',function(){
// launching the url in browser //
    browser.get("http://www.google.com");
    browser.takeScreenshot().then(function (png) {
    writeScreenShot(png, 'exception.png');
});
      element(by.model('testName')).sendKeys('Test Automation');
         // It performs the check whether the element exist or not //
         var myText = element(by.binding('myTestString')).getText();
         expect('Welcome to '+myText+'!').toEqual('Welcome to Test Automation!')
   });
});
Debug Protractor Tests On Online Selenium Grid Platform
In order to scale your testing efforts and test on multiple browsers and OS you can use a cloud Selenium Grid to perform cross browser testing. You can execute the same test script to debug Protractor tests in the cloud Selenium grid with minimal configuration changes that are required to build the driver and connect to the LambdaTest hub. Below is the updated script with the required changes for testing with cloud Selenium Grid for this Protractor tutorial.
test_config.js
// test_config.js //
// The test_config.js file servers as a configuration file for out test case //

LT_USERNAME = process.env.LT_USERNAME || "irohitgoyal"; // Lambda Test User name
LT_ACCESS_KEY = process.env.LT_ACCESS_KEY || "123456789"; // Lambda Test Access key

exports.capabilities = {
  'build': ' Automation Selenium Webdriver Test Script ', // Build Name to be display in the test logs
  'name': ' Protractor Selenium Debugging Test on Chrome',  // The name of the test to distinguish amongst test cases //
  'platform':'Windows 10', //  Name of the Operating System
  'browserName': 'chrome', // Name of the browser
  'version': '79.0', // browser version to be used
  'visual': false,  // flag to check whether to take step by step screenshot
  'network':false,  // flag to check whether to capture network logs
  'console':false, // flag to check whether to capture console logs.
  'tunnel': false // flag to check if it is required to run the localhost through the tunnel
  };

// setting required config parameters //
exports.config = {
   directConnect: true,

   // Desired Capabilities that are passed as an argument to the web driver instance.
   capabilities: {
      'browserName': 'chrome'  // name of the browser used to test //
   },

   // Flavour of the framework to be used for our test case //
   framework: 'jasmine',

   // The patterns which are relative to the current working directory when

protractor methods are invoked //

   specs: ['test_debug.js'],
// overriding default value of allScriptsTimeout parameter //
      allScriptsTimeout: 999999,
      jasmineNodeOpts: {
// overriding default value of defaultTimeoutInterval parameter //
      defaultTimeoutInterval: 999999
   },
   onPrepare: function () {
      browser.manage().window().maximize();
      browser.manage().timeouts().implicitlyWait(5000);
   }
};
test_debug.js
// test_debug.js //

// Build the web driver that we will be using in Lambda Test
var buildDriver = function(caps) {
  return new webdriver.Builder()
    .usingServer(
      "http://" +
      LT_USERNAME +
      ":" +
      LT_ACCESS_KEY +
      "@hub.lambdatest.com/wd/hub"
    )
    .withCapabilities(caps)
    .build();
};

// describing our test scenario for protractor framework //
describe(' Sample Protractor Test Suite for debugging example ',function(){

// adding the before an event that builds the driver and triggers before the test execution
  beforeEach(function(done) {
    caps.name = this.currentTest.title;
    driver = buildDriver(caps);
    done();
  });
// information about the test case
   it('An Example to perform Debug during Testing',function(){
// launching the url in browser //
      browser.get("http://www.google.com");
      browser.pause();
      element(by.model('testName')).sendKeys('Test Automation');
         // It performs the check whether the element exist or not //
         var myText = element(by.binding('myTestString')).getText();
         expect('Welcome to '+myText+'!').toEqual('Welcome to Test Automation!')
   });
});
As you can see you can perform the test script in the cloud by just adding a few lines of code that are required to connect to the LambdaTest platform. You are required to generate the desired capability matrix and through this, you can specify the environment on which you would like to execute our tests. Also, you need to add the LambdaTest username and access key which uniquely identifies with the LambdaTest platform. Here is the link to visit LambdaTest Selenium desired capabilities generator.
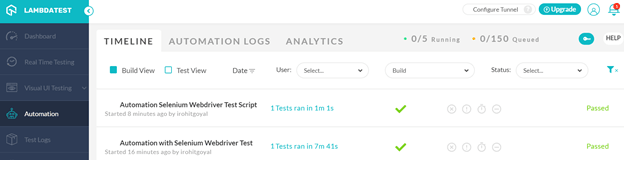
We can see that our Selenium test automation script got executed successfully on the platform and you can also execute the same set of commands that we used on the terminal while using the pause and debugger methods to debug Protractor tests. Below is the output on running the test:
Wrapping It Up!
This brings us to an end to this Protractor tutorial on how to debug Protractor tests. To sum up, I explained the challenge faced during the end to end application test. I further got into the detail of using the framework and in-built methods to debug Protractor test cases in an interactive manner. It can be put to good use especially when performing end to end testing and taking screenshots whenever required. Executing these tests on the cloud platform also has its own benefits in saving costs on the infrastructure setup and maximizing test coverage.
Do share your view on this Protractor tutorial with us in the comment section down below. Also, help us to share this article with your friends. That’s all folks! Happy Debugging!