


Take a look at traffic.tristantrouwen.com to see it in action! The code is available on Github: github.com/trirpi/traffic-visualization. Feedback, comments and/or suggestions are always welcome! Consider starring the project if you liked it.
The story.
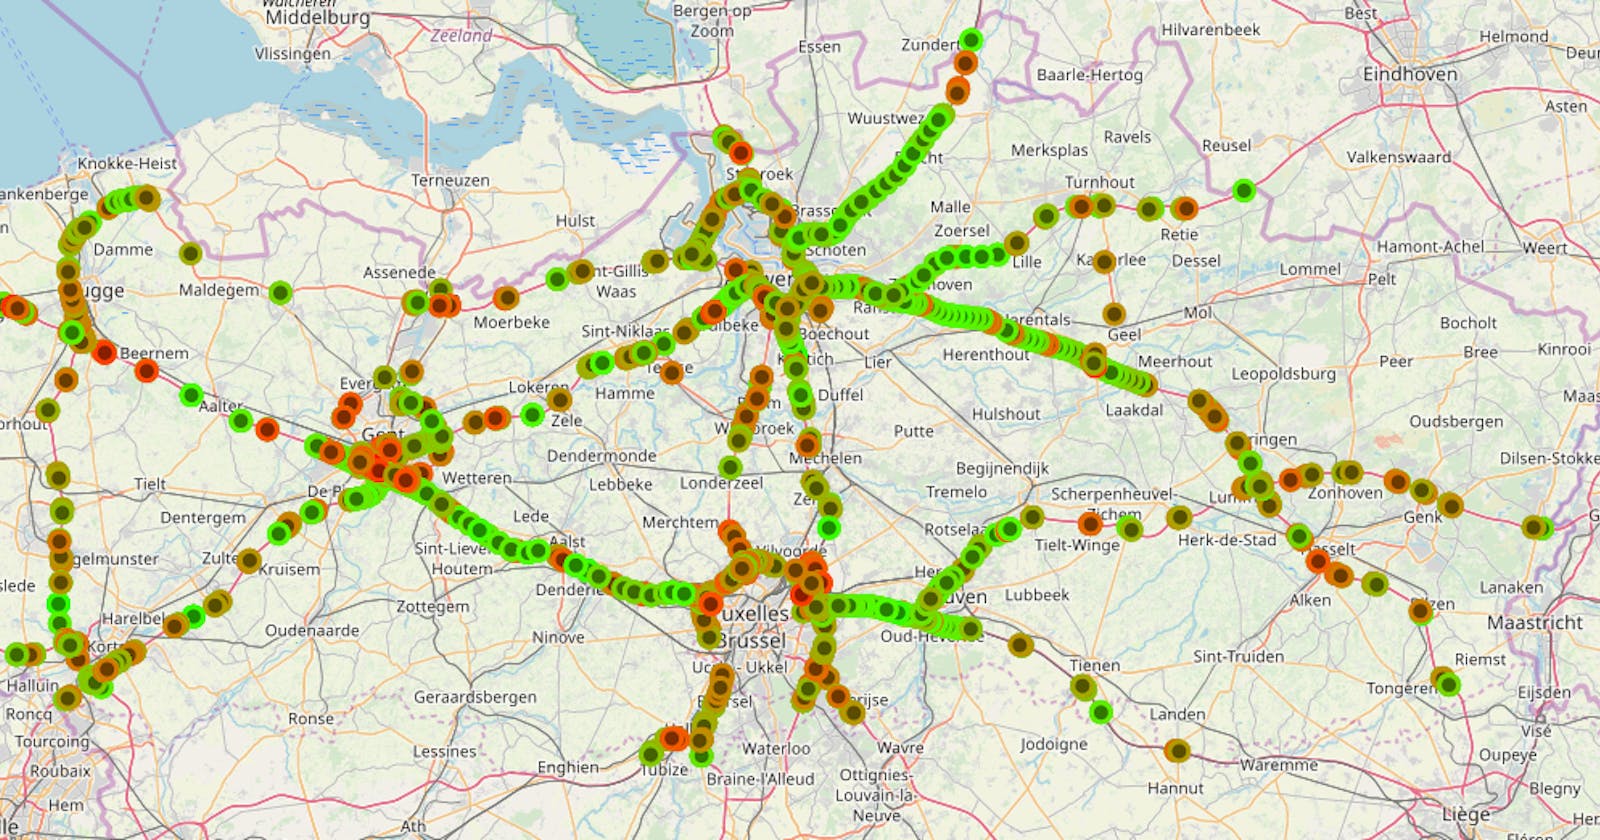
It is quite exciting times for data science (one of my interests). To improve my skills I thought it would be nice to learn d3.js, a javascript data visualization library. Using it in a project would be an excellent way to learn it. But to visualize data, one must first have data. I already had my eye on a site I discovered: data.gov.be/nl . It is a site maintained by the Belgian government and has a great variety of data (A lot of governments have free data repositories, so maybe try googling yours and find some interesting data). I quickly found an interesting dataset with real time updates of the traffic in Flanders.
First I build a scraper to put the data from the API in a more friendly JSON format. Then I started building the frontend. I initially planned to screenshot a map of Flanders and put dots on top of it. However, this was much harder than expected. On the way, I discovered this super cool library leaflet.js. In fact, it was so feature rich, I didn't need d3.js anymore. So, eventually I didn't learn any d3, but still learned a lot about other topics and had loads of fun while making it!