

Integrate Chart.js in your WordPress site and build fancy charts.
Well, data visualisation is a hot topic. In my day to day business I work a lot with WordPress and Vue.js. I can’t say how much I 💘 Vue.js and how much cleaner my workflow and code is, because of it.
Building large WordPress sites can be tricky, especially if you have a lot of interactions going on. But with Vue components, you can separate everything super clean. From time to time, you may want to include some cool charts to enchant your articles with nice data and it’s pretty easy with vue and chart.js.
Prerequisites
- 🔧 Advanced Custom Fields (duh, could not live without ‘em)
- ⚡ Vue.js
- 📊 vue-chart.js
I am building most projects with the bedrock stack and sage as a starting theme. However you can actually implement it in every other theme, too. However I am not going into detail how the build system works. I am using the sage webpack config, just a bit modified. If you’re using a different build system, you may have to change some of the steps and code examples.
Advanced Custom Fields are not essential to this, but they provide a super easy to use custom fields.
Custom Fields
So we first need to create some custom fields, to feed them with data.
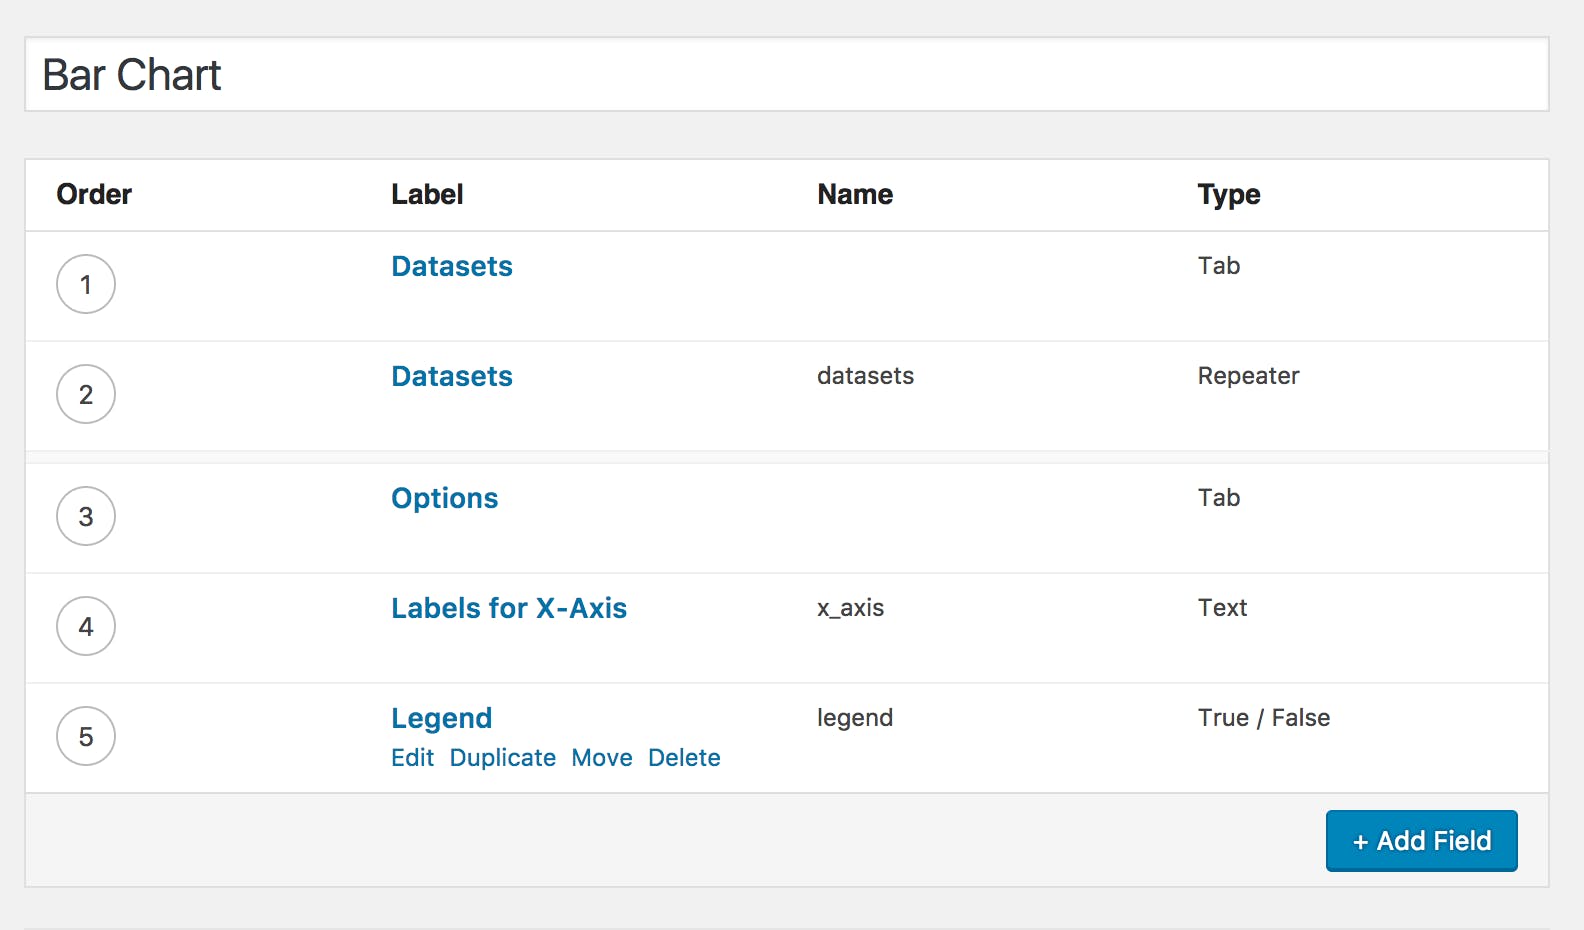
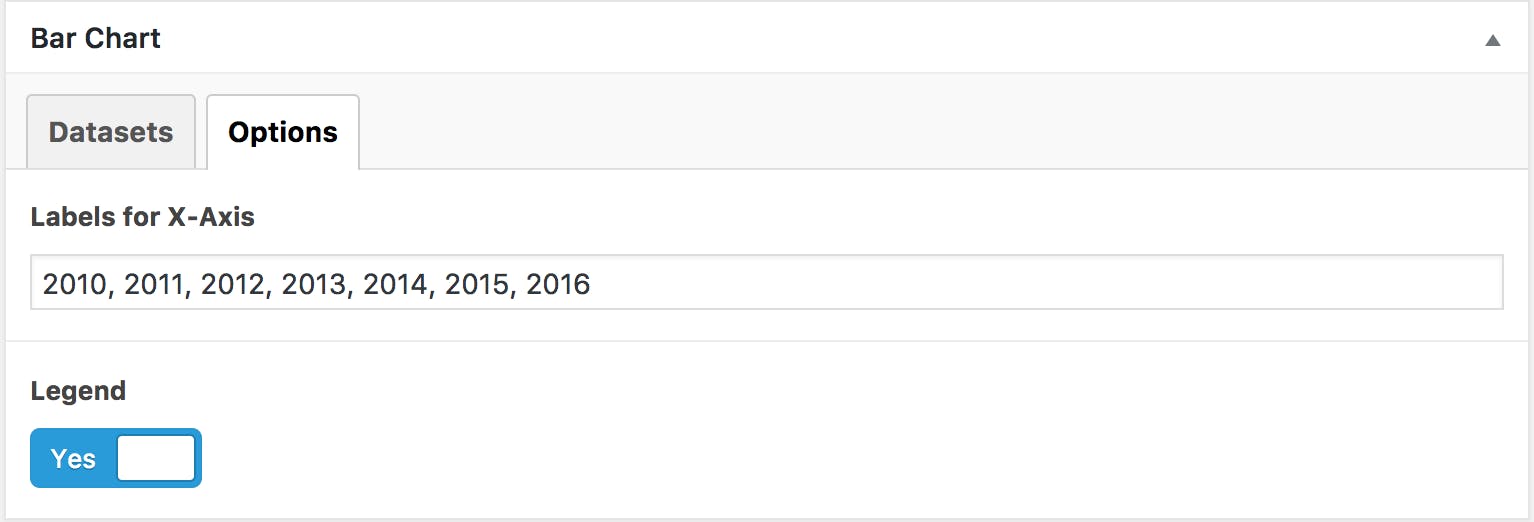
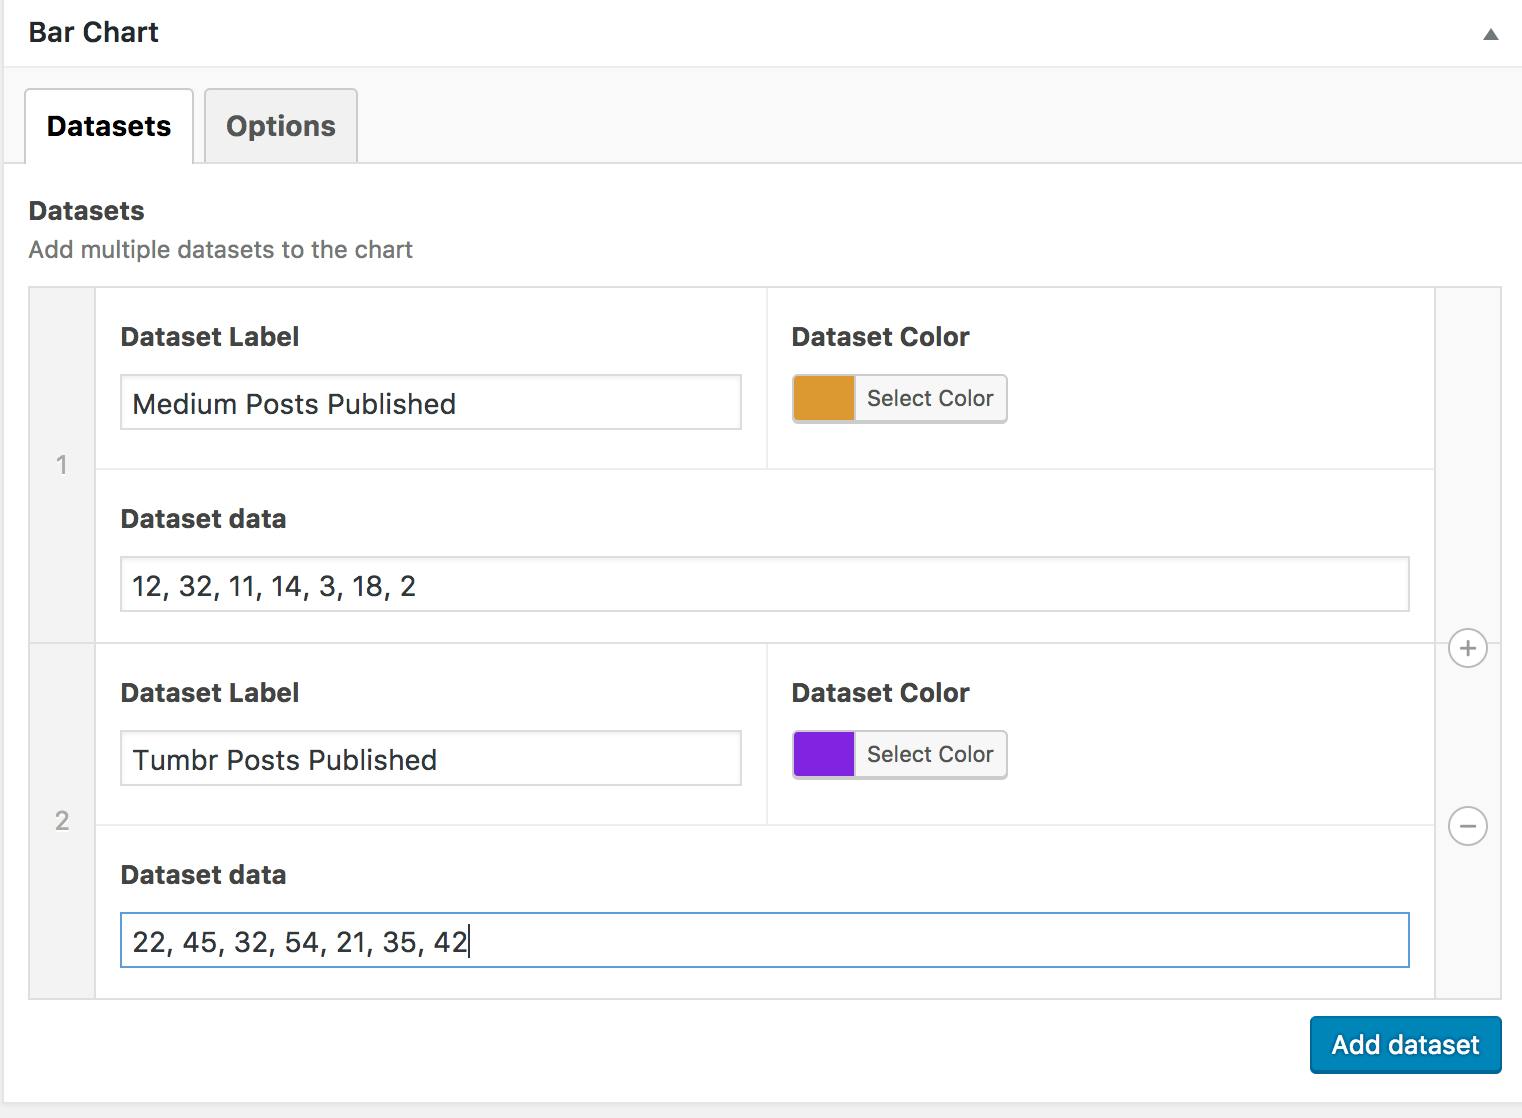
We create a repeater field for the datasets, which contain subfields. One field to toggle the legend and one field for the x-axis labels.
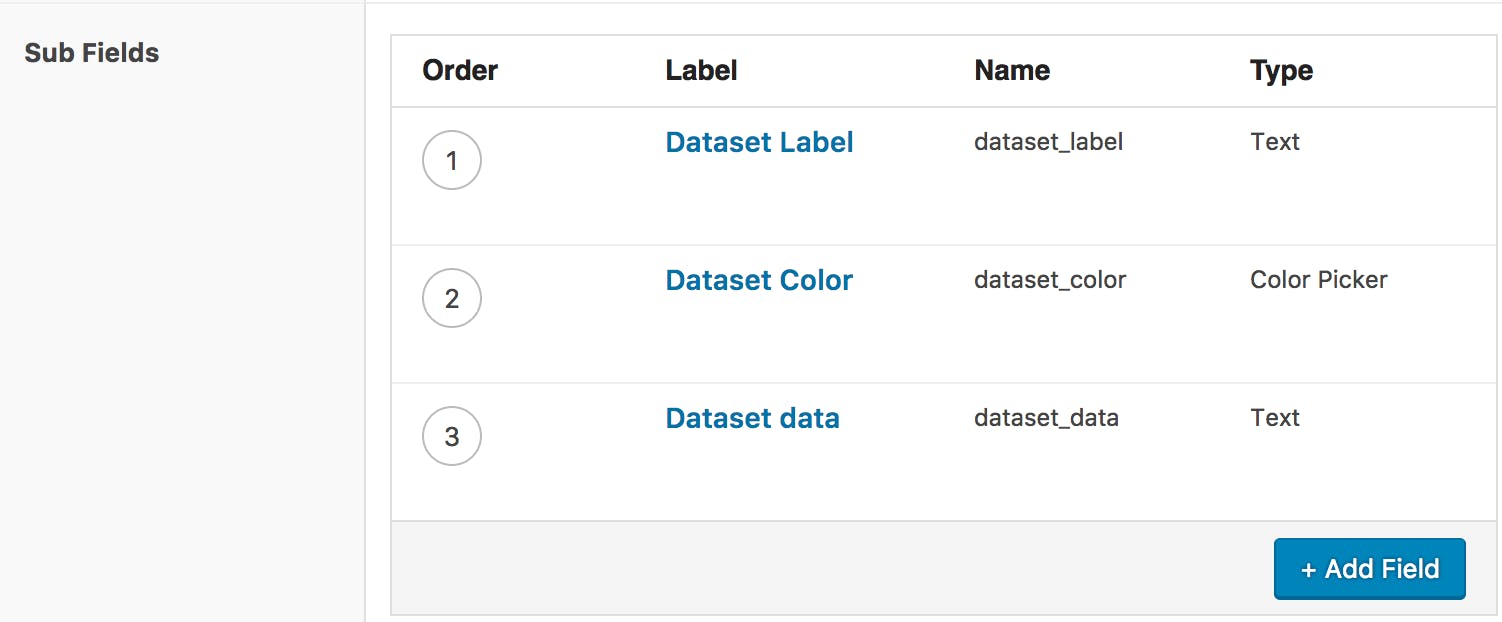
The subfields of the Dataset field are pretty straight forward. We have a label, color and the actual data.
Then we can fill our component with some sample data.
Make it vue
Now it is time to create our vue component. I expect that you already wired up vue to your WordPress site. We now have to install vue-chartjs and create a bar chart component.
npm install vue-chartjs -S
Create a bar chart component
So we create a BarExample.js in our assets folder:
import { Bar } from ‘vue-chartjs’
export default Bar.extend({
 props: [“data”, “options”],
 mounted () {
  this.renderChart(this.data, this.options)
 }
})
Thats the basic structure from the examples. We pass the data and chart options. Then we add it as a vue component in our main.js file.
The structure of the required data object for chart.js looks like this:
{
      labels: ['X Axis Label 1', 'X Axis Label 2'],
      datasets: [
        {
          label: 'Data One',
          backgroundColor: '#f87979',
          data: [40, 20, 12]
        }
      ]
}
There are now two possibilities, how to build this object. One is, to build it up in php the second is to build it up in Javascript. I personally find it a bit ugly to build it up in php, so I do it in Javascript.
For this purpose I change our BarExample. And add two new properties: One for the x-axis labels and one for the datasets. Then I utilize computed properties to build it up.
import { Bar } from 'vue-chartjs'
export default Bar.extend({
  props: ['labels', 'datasets'],
  computed: {
    'chartdata': function () {
      return {
        labels: this.labels,
        datasets: this.datasets
      }
    }
  },
 mounted () {
    this.renderChart(this.chartdata,
    {responsive: true, maintainAspectRatio: false})
  }
})
Template
Now it’s time to wire it up a bit. We create a template file for the acf content to have a clean component.
<?php if(have_rows('datasets')): ?>
  <?php
    $datasets = [];
   ?>
<?php while ( have_rows('datasets') ) : the_row();
    $datasets[] = array(
      'label' => get_sub_field('dataset_label'),
      'backgroundColor' => get_sub_field('dataset_color'),
      'data' => explode(', ', get_sub_field('dataset_data'))
    );
  endwhile;
$labels = get_field('x_axis');
  $legend = get_field('legend');
$chartDatasets = htmlspecialchars(json_encode($datasets));
  $chartLabels = htmlspecialchars(json_encode(explode(', ', $labels)));
?>
<section class="chart-box text">
  <div class="text__wrapper">
    <bar-example
      :labels="<?= $chartLabels; ?>"
      :datasets="<?= $chartDatasets; ?>" >
    </bar-example>
  </div>
</section>
<?php endif; ?>
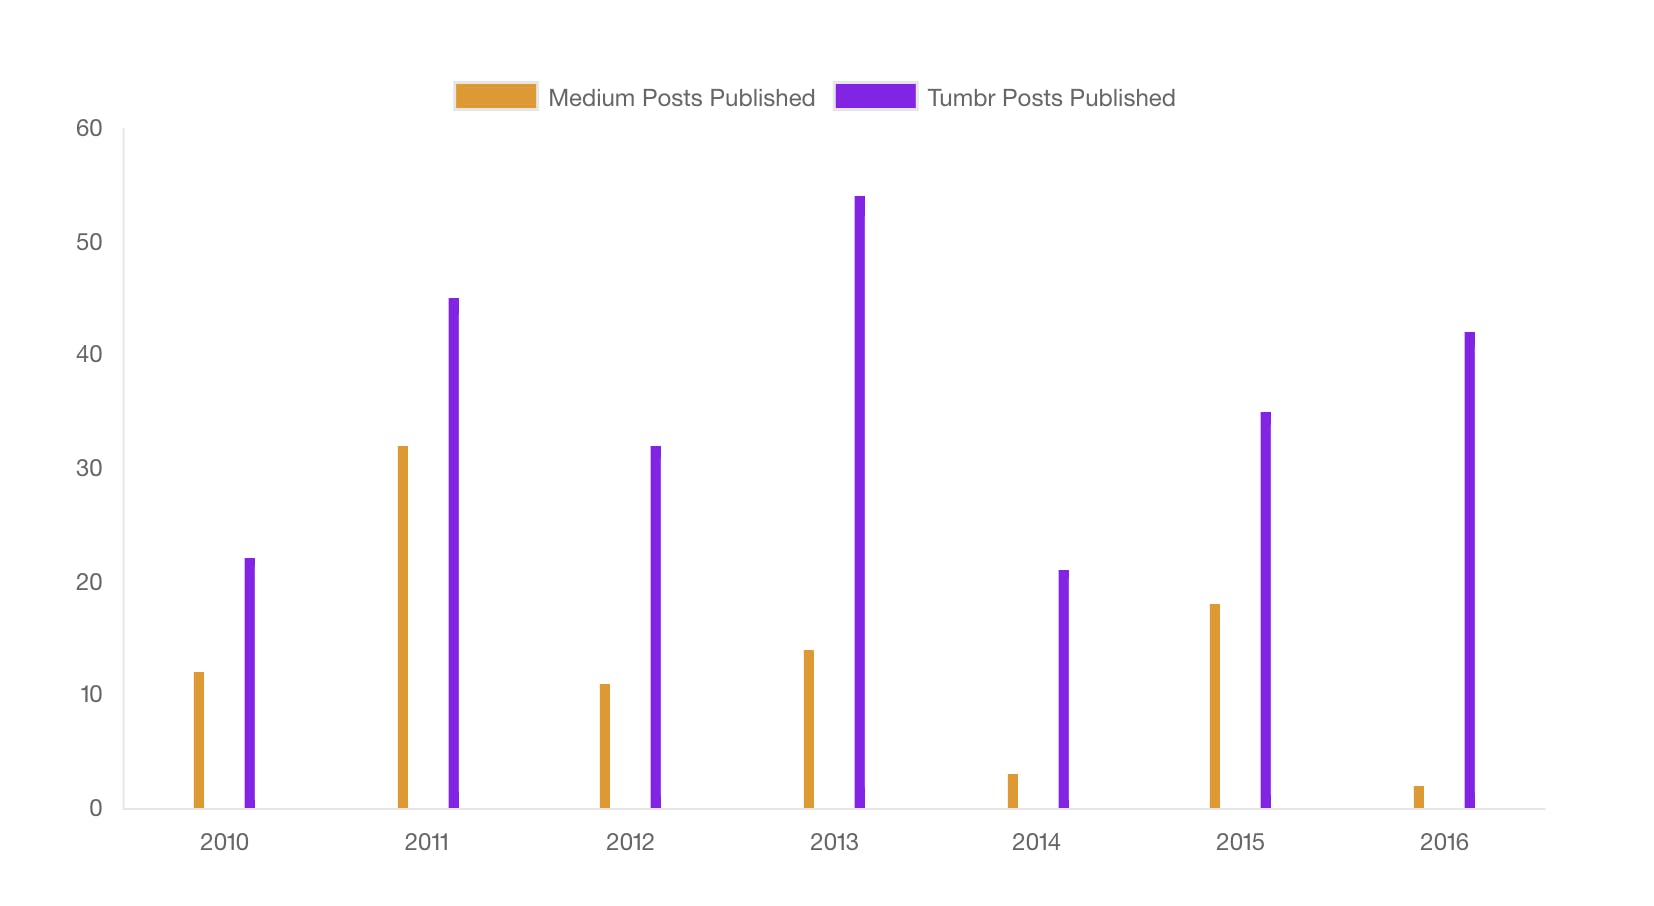
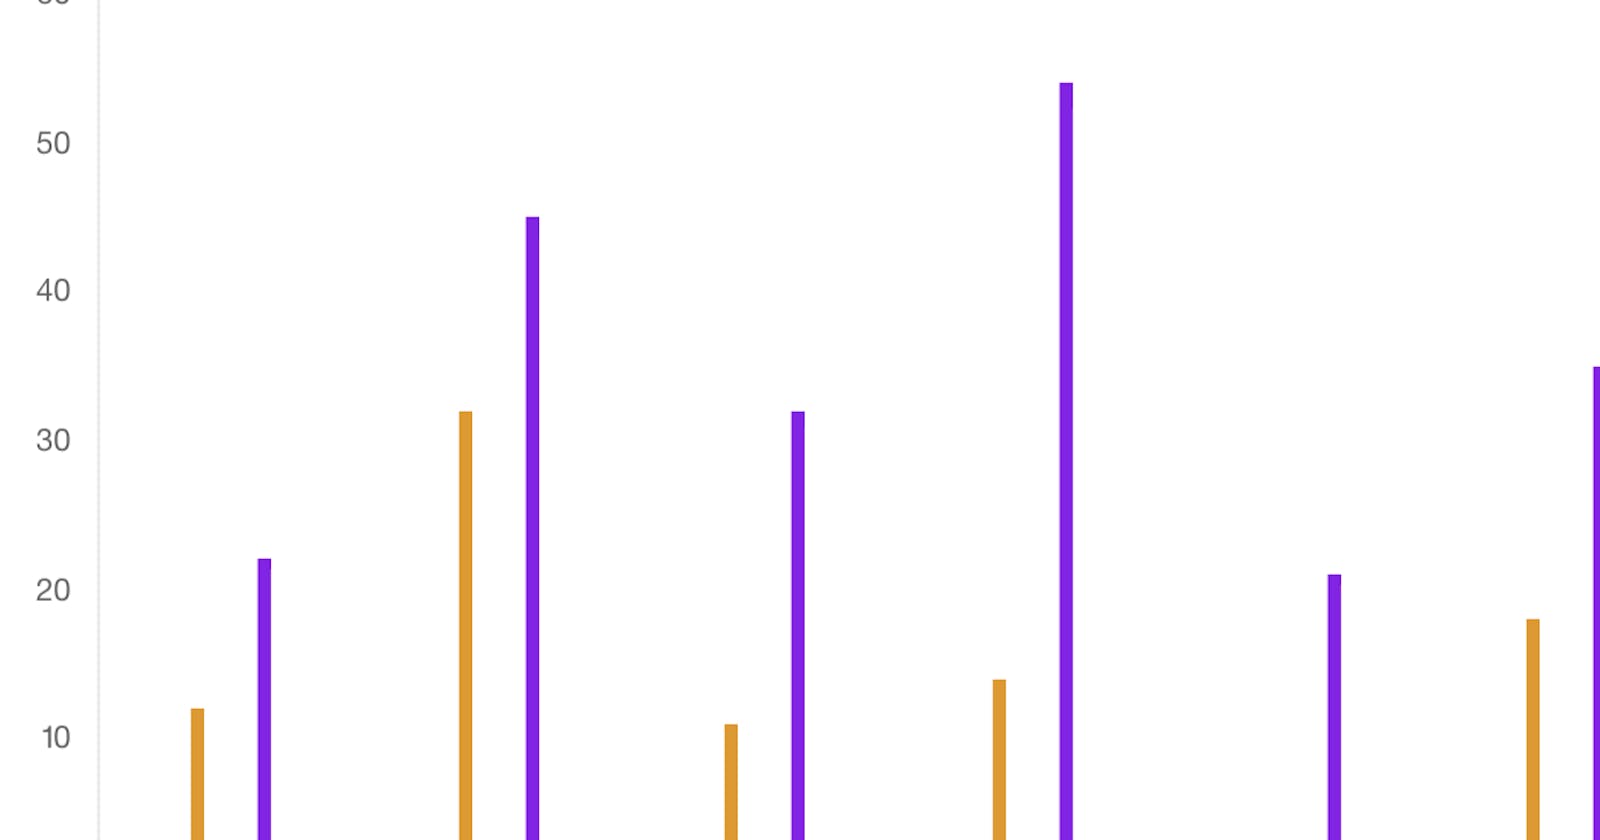
Now you can add the php component to posts or pages and we have our beautiful chart.