Shailesh Bshaileshb.hashnode.dev·Nov 20, 2024Implementing Chart.js in AngularData visualization is an essential part of web development, helping developers present complex data in a simple way. This series will focus on Chart.js, a popular JavaScript library for creating interactive charts, and show how to use it in an Angula...Chart.js and Angular: A Developer’s Guidechartjs
Ali Tavallaietechbend.hashnode.dev·Aug 19, 2024Finally Updating Pychartjs: Making It Framework-Agnostic and Compatible with All Python Web FrameworksAfter years of taking over the maintenance of pychartjs, I'm excited to finally have the time to bring some much-needed updates to the project. It's been a journey, but I'm proud to say that pychartjs is now framework-agnostic and fully compatible wi...33 readscharts
Mohd Zaidzaidmstrr.hashnode.dev·Jul 18, 2024Modernizing a 2013 Bitcoin Solution with 2024 Web TechnologiesHello readers, recently I secured a summer internship called "Summer of Bitcoin," which is another great story I will talk about in another blog. Continuing, after I wrote a proposal for a project named "Create new Web User Interface for Gocoin clien...2 likes·35 readsBitcoin
Opemipo DisuforLatitudelatitude.hashnode.dev·May 16, 20247 Best Chart Libraries For Developers In 2024 🤯Many applications use charts or graphs for data visualization, which can be implemented using libraries or underlying technologies. Libraries offer time efficiency, a variety of chart types, and customization options. As a developer, understanding th...4 likes·30 readsProgramming Blogs
Solomon M. Kamangablog.solomonkamanga.com·Apr 16, 2024Integrating Chart.js in Yii2: A Step-by-Step Guide with Practical ExamplesThis article is crafted for Yii2 developers aiming to integrate Chart.js for dynamic and interactive data visualization. We take a deep dive into the process, covering data retrieval from MySQL, data processing, and chart implementation. This guide i...53 readsPHP
Shreyas Ingaleshreyasingale.hashnode.dev·Feb 27, 2024Learn how to create an Interactive Data Visualisation on a Map using Chart.js, OpenLayers and Next.js.In recent past, I found myself confronted with a compelling challenge: how to seamlessly integrate data visualization with interactive maps. It was a puzzle I hadn't encountered before, but one that intrigued me deeply. As I delved into the intricaci...interactive map
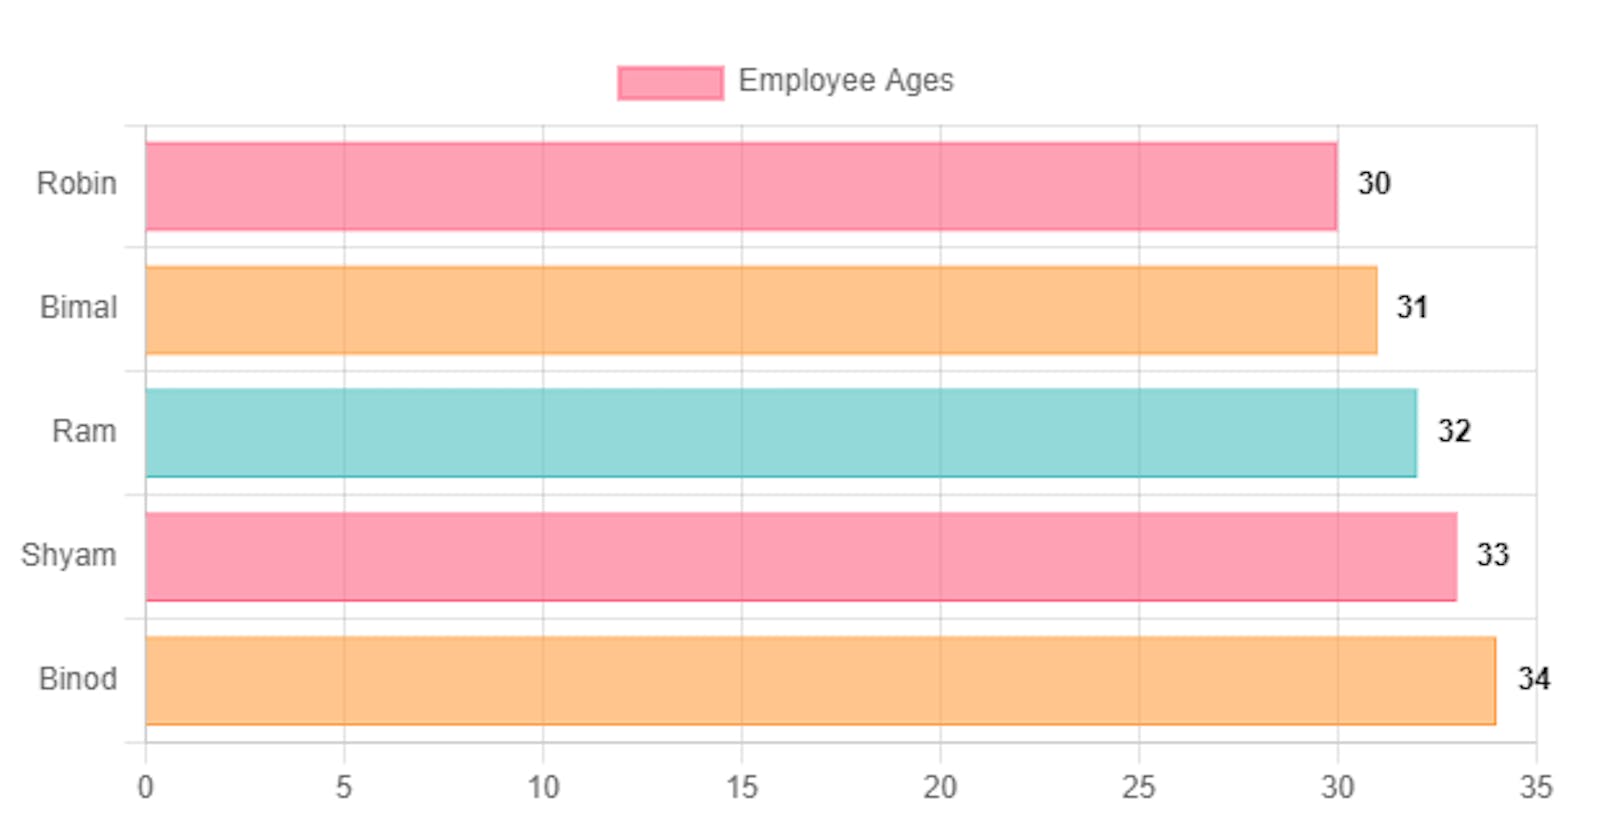
Biplab Sinhapbphpsolutions.hashnode.dev·Oct 10, 2023How to draw a horizontal bar chart using Chart JSHi friends, in this tutorial, you will learn how to draw a horizontal bar chart using Chart JS. Actually drawing a horizontal bar chart is the same as drawing a normal bar chart but the only difference is setting up the axis to 'y' in the options arr...chartjs
Utkarsh Nagarutkarshnagar.hashnode.dev·May 1, 2023Chart.js: Striking Charts in a Few Simple StepsIntroduction Data is everywhere, and developers are tasked with presenting it in a way that is easy to understand. As a developer, you understand the importance of data visualization in creating compelling and informative applications. That’s where c...27 reads2Articles1Week
Gideon Akinsanmigidakinsanmi.hashnode.dev·Apr 22, 2023How to build charts with Chart.jsChart.js is one of the most popular JavaScript charting libraries. It’s the only chart library with over 2.7m weekly downloads on npm and 60k stars on GitHub. With Chart.js, you can easily create and customize different kinds of charts. At the end of...3 likes·54 readsJavaScript
freeCodeCampforfreeCodeCampfreecodecamp.org·Mar 30, 2023How to Integrate Chart.js in Angular Using Data from a REST APIBy Deji Adesoga Charts are a great way of visually displaying large sets of data in formats that are easy to understand and analyze. They are a great way of showing the relationship that exists between two or more data sets. Different types of chart...Angular