Lucylucy26.hashnode.dev·Dec 24, 2024R vs. Python: Which Language Is Best for Data Science?1. Overview Data science has transformed sectors by facilitating data-driven decision-making through insights gained from massive volumes of data. Programming languages that enable data scientists to efficiently manage, analyze, and visualize data ar...Python
Jahid Hasanhasnode.msjahid.me·Nov 28, 2024🌟 ɪɴᴛʀᴏᴅᴜᴄɪɴɢ ᴛʜᴇ ʀᴏꜱᴇ ᴘɪɴᴇ ᴛʜᴇᴍᴇ ꜰᴏʀ ʀ: ᴇɴʜᴀɴᴄɪɴɢ ɢɢᴘʟᴏᴛ2 ᴠɪꜱᴜᴀʟɪᴢᴀᴛɪᴏɴꜱ ᴡɪᴛʜ ᴇʟᴇɢᴀɴᴛ ᴍɪɴɪᴍᴀʟɪꜱᴍ 🌟🚀 I’m thrilled to present the Rose Pine Theme for R, a custom aesthetic for ggplot2 that blends modern minimalism with the serene elegance of the Rose Pine design philosophy. Drawing inspiration from its Python counterpart, this R-specific implement...R Language
Md. Fahim Bin AminforfreeCodeCampfreecodecamp.org·Oct 3, 2024How to Run R Programs Directly in Jupyter Notebook LocallyR is a popular programming language that’s now widely used in research-related fields like Bioinformatics. And to use R, you’ll need to install the R Compiler and R Studio. But did you know that you can also directly run your R code right in a Jupyte...R
Indraneel Chakrabortyindraneel.hashnode.dev·Jul 26, 2024ClinTrialX: Simplifying Clinical Trials Data Fetching Using RVisit: https://ineelhere.github.io/clintrialx/ The clintrialx R package offers an easy and user-friendly way to interact with clinical trial data sources, specifically ClinicalTrials.gov and the AACT (Aggregate Analysis of ClinicalTrials.gov) databas...clinical trials
Madhu Srimadhu-blogs.hashnode.dev·May 23, 2024Learn with me from A to Z : R langIntroduction Imagine R as a special code that tells computers what to do with data. It's like giving instructions to a robot friend. R is a programming language used by scientists, data analysts, and researchers to explore, analyze, and visualize dat...1 likeR Language
Vignesh T Dvigneshtd.hashnode.dev·Apr 13, 2024R or Python? Best Friend For Data Science?Choosing Between R and Python for Data Science Learning When starting out in data science, one of the first decisions you'll face is choosing the programming language to learn. The two frontrunners in this field are R and Python. Both languages have ...28 readsData Science
Jyoti Bhogaljyotibhogal.hashnode.dev·Dec 9, 2023CO2 Chronicles: Navigating SDGs with Data VisualsIntroduction To foster a sustainable lifestyle globally, the United Nations has established the Sustainable Development Goals (SDGs), a comprehensive framework consisting of 17 targets set to be achieved by 2030. Each goal is accompanied by specific ...89 readsR Language
Richard Careagaparadigm.hashnode.dev·Oct 14, 2023The R Data Scientist has an interview with a litigator$$y = f(x)$$Good morning. I'm Olivia Freeman, a litigation partner here at Stackpole and Jimenez. I will interview you to assess your potential as a trainer for data scientists who will be delivering testimony before juries in major cases. We will be...R Language
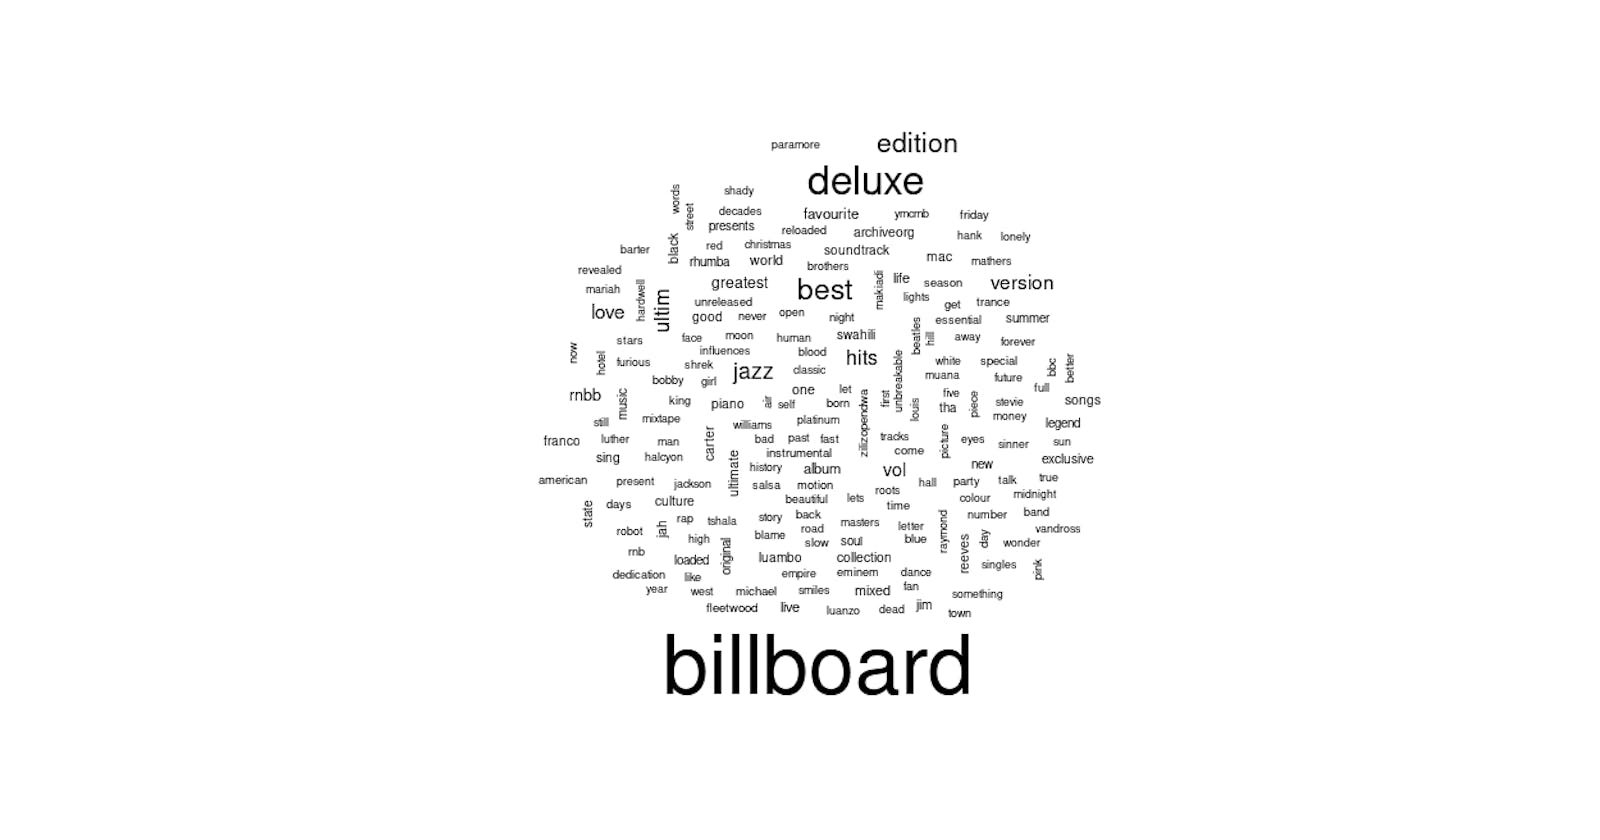
Kasyoki “Collins” Thanokasyokithano.hashnode.dev·Sep 20, 2023Text Analysis using REver wondered what you can do with text information and an analytical tool like R Text analysis is a branch of data analytics concerned with the extraction of text information and insights from datasets. This makes it a useful tool in our times, as m...R
Esli Silvaesli.blog.br·Aug 21, 2022Instalando o R no LinuxO que é o R? R é uma linguagem para computação estatística e gráficos. É um projeto GNU que é semelhante à linguagem S que foi desenvolvido nos Laboratórios Bell (anteriormente AT&T, agora Lucent Technologies) R pode ser considerado como uma impleme...84 readsTechR Language