Ali Hassan Khan Yousafzaialihassankhan.hashnode.dev·Oct 27, 2024Observability FundamentalsWhat is Observability?Observability refers to a system’s capability to expose its internal workings, offering insights into key metrics like CPU usage, memory status, disk activity, and request failures. This visibility helps optimize infrastructure ...observability
Tom X NguyenforDwarves Foundation's Team Blogdwarvesf.hashnode.dev·Oct 16, 2024TracingWhat is tracing Tracing is a way to keep track of, debug, and get a clear picture of how an LLM app is running. It gives a detailed snapshot of a specific action, like making a call to the LLM, formatting a prompt, or running a function. A trace is j...llm
Justin Thurmantil.justinthurman.dev·Aug 30, 2024Instrumentation and Django's StreamingHttpResponseIn my work at Bevy, I recently implemented a streaming endpoint in our Django app using StreamingHttpResponse. For anyone unfamiliar with this class, using it is straightforward. You just need to pass it some iterable, and it will stream the content....46 readsDjango
Al Duncansonalduncanson.com·Aug 21, 2024O11y on RailsIn my last article, Observability in Software, I explored the concept of observability, or o11y, and its role in maintaining and improving visibility in software systems. https://alduncanson.com/observability-in-software Given this critical role, i...o11y
Dharmesh Vayablog.kloudzone.co.in·Jul 29, 2024Unveiling Yor: Your IaC Tracing CompanionSecuring your Infrastructure as Code Introduction Infrastructure as Code (IaC) has revolutionized the way we manage and deploy IT infrastructure. It provides numerous benefits, including increased efficiency, improved consistency, and reduced errors....YOR
Al Duncansonalduncanson.com·Jul 16, 2024Observability in softwareO11y, pronounced similar to “folly” without the “f”, is a numeronym commonly used to refer to observability in relation to software infrastructure. We get o11y by taking the first and last letters in the word “observability”, and replacing the inner ...o11y
Yilia Linapi7.hashnode.dev·Mar 20, 2024Enhancing API Observability Series (Part 3): TracingIntroduction What Is Distributed Tracing? In today's landscape of microservices architecture and distributed systems, a single request often traverses multiple services, each containing various internal processing steps. To ensure the efficient and s...54 likes·26 readsobservability
Karan SajnaniforChakravyuha - The Digital Battlefieldblog.rudrasecure.com·Aug 25, 2023The eBPF -3 uprobesBefore we start, I want to highlight the difference between bpftrace and eBPF programs. eBPF Programs: eBPF programs are a bit more complex and require writing two separate sections of code - one for userspace, and one for kernel space. These program...101 readseBPF
Karan SajnaniforChakravyuha - The Digital Battlefieldblog.rudrasecure.com·Aug 13, 2023The eBPF - 2In this blog, we will continue with tracing. We'll aim to get a basic understanding of: How processes work Exit codes Forking of processes Exit tracepoints (of the execve() syscall) Recommended reading: If you've not read the first article, ple...277 readseBPF
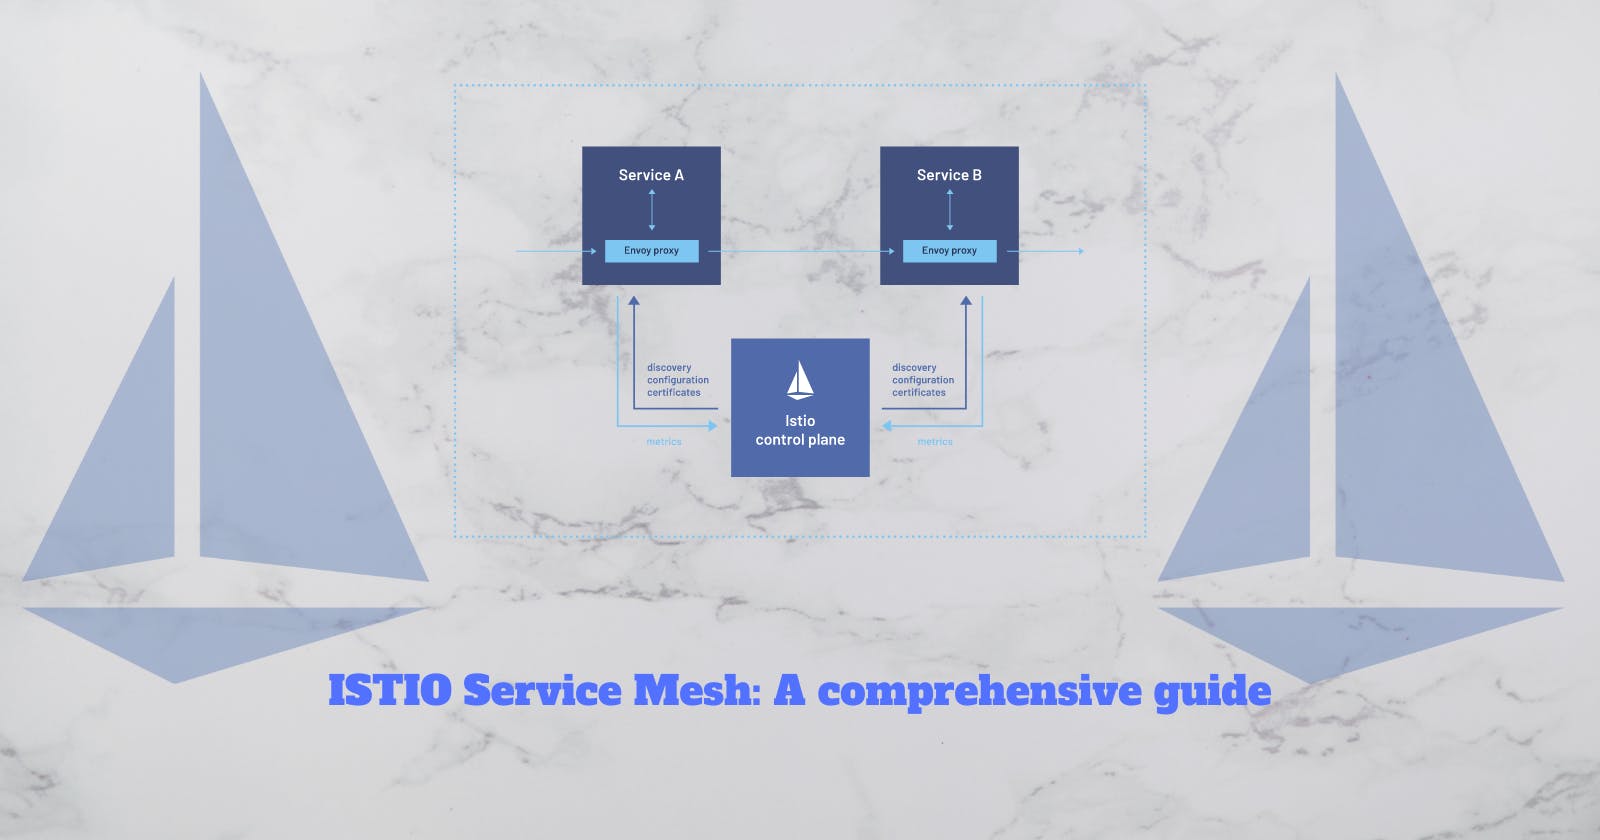
Abhishek Singhopscribe.blog·Jul 28, 2023Understanding Istio Service Mesh: A Comprehensive GuideIn the world of microservices, managing communication between services can be a daunting task. This is where Istio and service mesh come into play, simplifying the complex configurations and enhancing the security of applications with sensitive user ...10 likes·28 reads#istio