GayathriRamalingamgayathriramalingam.hashnode.dev·Apr 24, 2024Chart of the Week: Creating a .NET MAUI Sunburst Chart to Visualize the Most Popular Wikipedia ArticlesTL;DR: Let’s visualize the most popular Wikipedia articles of 2023 using Syncfusion .NET MAUI Sunburst Chart. Learn to gather, bind, and visualize data effectively while customizing chart elements to represent data trends. Welcome to the Chart of the...Discusschart
GayathriRamalingamgayathriramalingam.hashnode.dev·Apr 17, 2024Chart of the Week: Creating a WPF Stacked Area Chart to Visualize Wealth Distribution in the U.S.TL;DR: Learn to visualize wealth distribution in the U.S. from 1990 to 2023 using Syncfusion WPF Stacked Area Chart. Explore a step-by-step guide on data preparation, chart layout design, customization, and more. Dive into insightful analysis with th...Discusschart
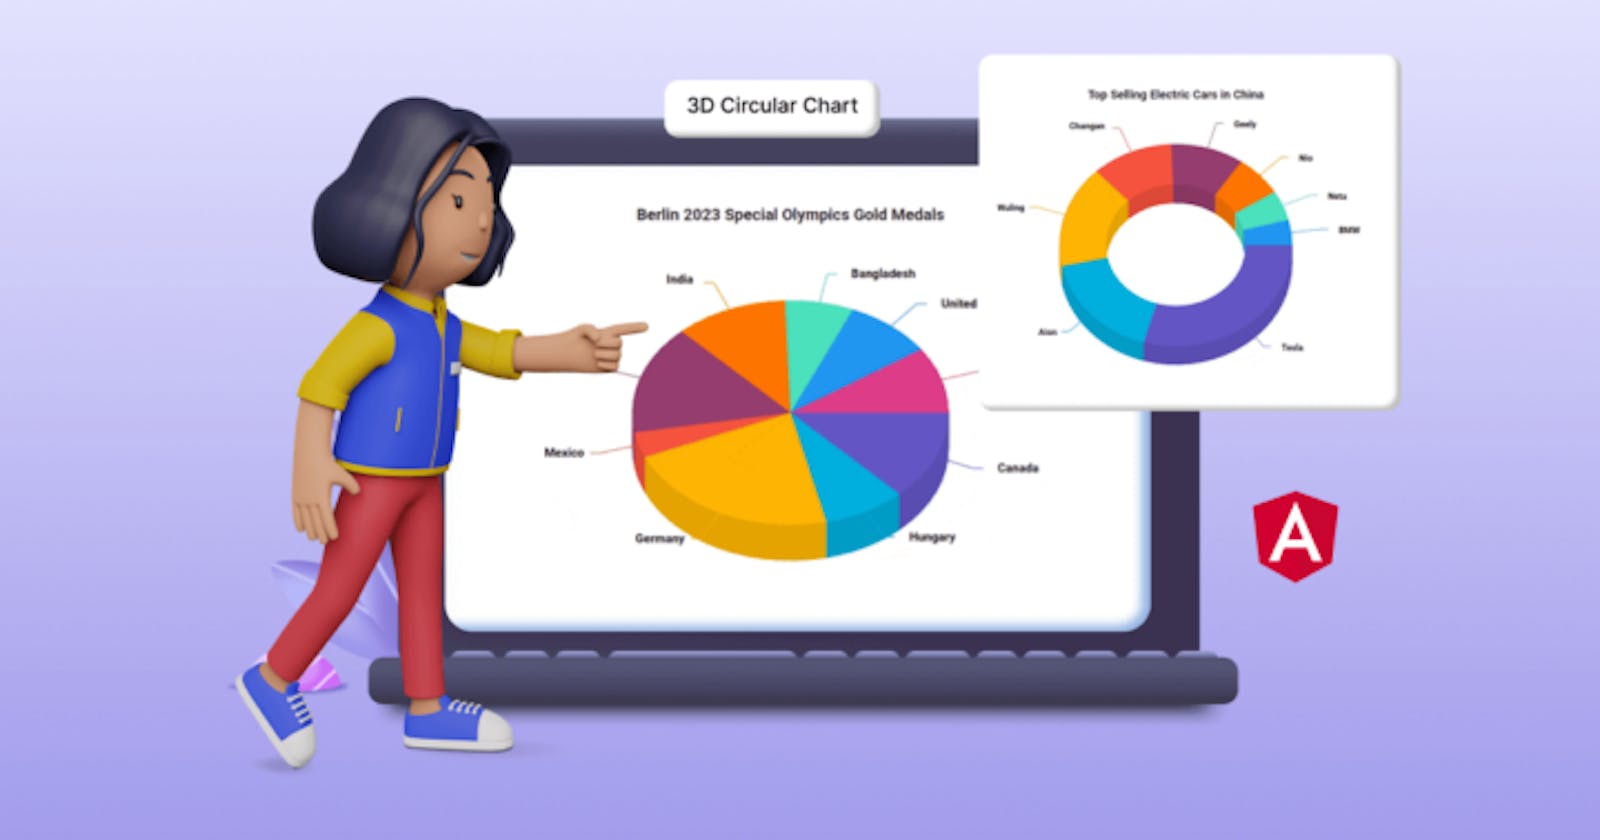
GayathriRamalingamgayathriramalingam.hashnode.dev·Apr 3, 2024Unveiling the New Angular 3D Circular Charts ComponentTLDR: Exploring the new Syncfusion Angular 3D Circular Charts component, visualizing data with its marvelous features and code examples. We are thrilled to introduce the new [Angular 3D Circular Charts](https://www.syncfusion.com/angular-components/a...DiscussAngular
GayathriRamalingamgayathriramalingam.hashnode.dev·Apr 3, 2024Chart of the week: Creating a WPF 3D Column Chart to Visualize the Panama Canal’s Shipment Transit DataTLDR: Gathering and visualizing the data on Panama Canal shipment traffic using the Syncfusion WPF 3D Column Chart, customizing the chart’s title, axis, position, data labels, and other elements for enhanced insights. Welcome to our Chart of the Week...Discusschart
GayathriRamalingamgayathriramalingam.hashnode.dev·Mar 27, 2024Chart of the Week: Creating a .NET MAUI Column Chart to Visualize the Corporate Investment in AITLDR: Gathering and binding the data on the corporates’ investment in AI over the years and visualizing the data using the Syncfusion .NET MAUI Column Chart. We’ll also customize the chart’s title, axis, series, background view, and other elements fo...Discusschart
GayathriRamalingamgayathriramalingam.hashnode.dev·Mar 27, 2024Chart of the Week: Creating a .NET MAUI Column Chart to Visualize the Corporate Investment in AITLDR: Gathering and binding the data on the corporates’ investment in AI over the years and visualizing the data using the Syncfusion .NET MAUI Column Chart. We’ll also customize the chart’s title, axis, series, background view, and other elements fo...Discusschart
GayathriRamalingamgayathriramalingam.hashnode.dev·Mar 20, 2024Chart of the Week: Creating a .NET MAUI Fast Line Chart to Visualize the Arctic Sea Ice Extent Since 2000TLDR: Gathering the data on the Arctic Sea ice cover since 2000 and visualizing the data by customizing the appearance of the Syncfusion .NET MAUI Fast Line Chart. Welcome to our Chart of the Week blog series! Today, we will visualize the extent of A...Discusschart
Syncfusionsyncfusion-blogs.hashnode.dev·Mar 20, 2024Chart of the Week: Creating a .NET MAUI Fast Line Chart to Visualize the Arctic Sea Ice Extent Since 2000TLDR: Gathering the data on the Arctic Sea ice cover since 2000 and visualizing the data by customizing the appearance of the Syncfusion .NET MAUI Fast Line Chart. Welcome to our Chart of the Week blog series! Today, we will visualize the extent of A...Discusschart
GayathriRamalingamgayathriramalingam.hashnode.dev·Mar 20, 2024Chart of the Week: Creating a .NET MAUI Fast Line Chart to Visualize the Arctic Sea Ice Extent Since 2000TLDR: Gathering the data on the Arctic Sea ice cover since 2000 and visualizing the data by customizing the appearance of the Syncfusion .NET MAUI Fast Line Chart. Welcome to our Chart of the Week blog series! Today, we will visualize the extent of A...Discusschart
GayathriRamalingamgayathriramalingam.hashnode.dev·Mar 20, 2024Chart of the Week: Creating a .NET MAUI Fast Line Chart to Visualize the Arctic Sea Ice Extent Since 2000TLDR: Gathering the data on the Arctic Sea ice cover since 2000 and visualizing the data by customizing the appearance of the Syncfusion .NET MAUI Fast Line Chart. Welcome to our Chart of the Week blog series! Today, we will visualize the extent of A...Discusschart