Omar Urbano | LightningChartlightningchart.hashnode.dev·Nov 12, 2024LightningChart Python 1.0Hey guys! I'm excited to share with you that LightningChart is officially releasing its Python graphics visualization library version 1.0. As some of you may know, I usually write tutorials and articles about JavaScript (and .NET too!) but this time,...Discusscharting library
Omar Urbano | LightningChartlightningchart.hashnode.dev·Nov 6, 2024LightningChart JS v.6.1 has been released!Hey there, I'm glad to share with you the new release of LightningChart JS 6.1. If you have read my previous articles, you may have seen that LightningChart JS is the library behind all our chart tutorials. So, here's some information about the relea...Discusslightningchart
Omar Urbano | LightningChartlightningchart.hashnode.dev·Oct 10, 2024Releasing LightningChart .NET v.12.1.1: Enhanced Features and Performance BoostsI'm excited to announce the release of LightningChart .NET v.12.1.1, which brings significant enhancements and performance boosts. Here are the key improvements: HexagonShape is available for Points and Markers We are introducing the hexagon shape a...DiscussData Science
Michael Amachreemichaelish.hashnode.dev·Sep 15, 2024Essential Svelte Chart Library for DevelopersA Question Have you ever spent what feels like an eternity scouring the web for the perfect charting library, only to come up empty-handed? That was me today while working on my Svelte Mini Apps project. I needed a library that was: Easy to Use: Sea...DiscussSvelte
Omar Urbano | LightningChartlightningchart.hashnode.dev·Aug 6, 2024Releasing LightningChart JS 6.0Hello again! I'm excited to share that LightningChart JS 6.0 has been released. This is a major update and features several improvements. Here's a brief review of the changes: Reworked gauge charts LCJS 6.0 introduces quite impressive reworked gauge ...Discusslightningchart
Omar Urbano | LightningChartlightningchart.hashnode.dev·Jun 10, 2024LightningChart .NET v.12 is out now!LightningChart .NET is a high-performance charting library designed for use in .NET applications. LightningChart .NET is optimized for: high-performance applications supports a wide range of chart types (line charts, bar charts, scatter plots, heat...Discuss·54 readslightningchart
Omar Urbano | LightningChartlightningchart.hashnode.dev·Jun 4, 2024Building a JavaScript Scatter Chart for Analyzing Customer SatisfactionThis article will use an XY chart to create a scatter chart with custom images for each data point series for analyzing customer satisfaction using personalized images. We will assign personalized emojis to help us identify the level of customer sati...Discuss#data visualisation
Omar Urbano | LightningChartlightningchart.hashnode.dev·May 21, 2024JavaScript Sweeping Area Chart with LightningChart JSIntroduction Hello! In this article we will work with an XY chart and create an area chart, but with a sweep effect that will update data in real time. Area charts allow us to identify the trends we have over time. This chart uses lines and shaded ar...DiscussJavaScript
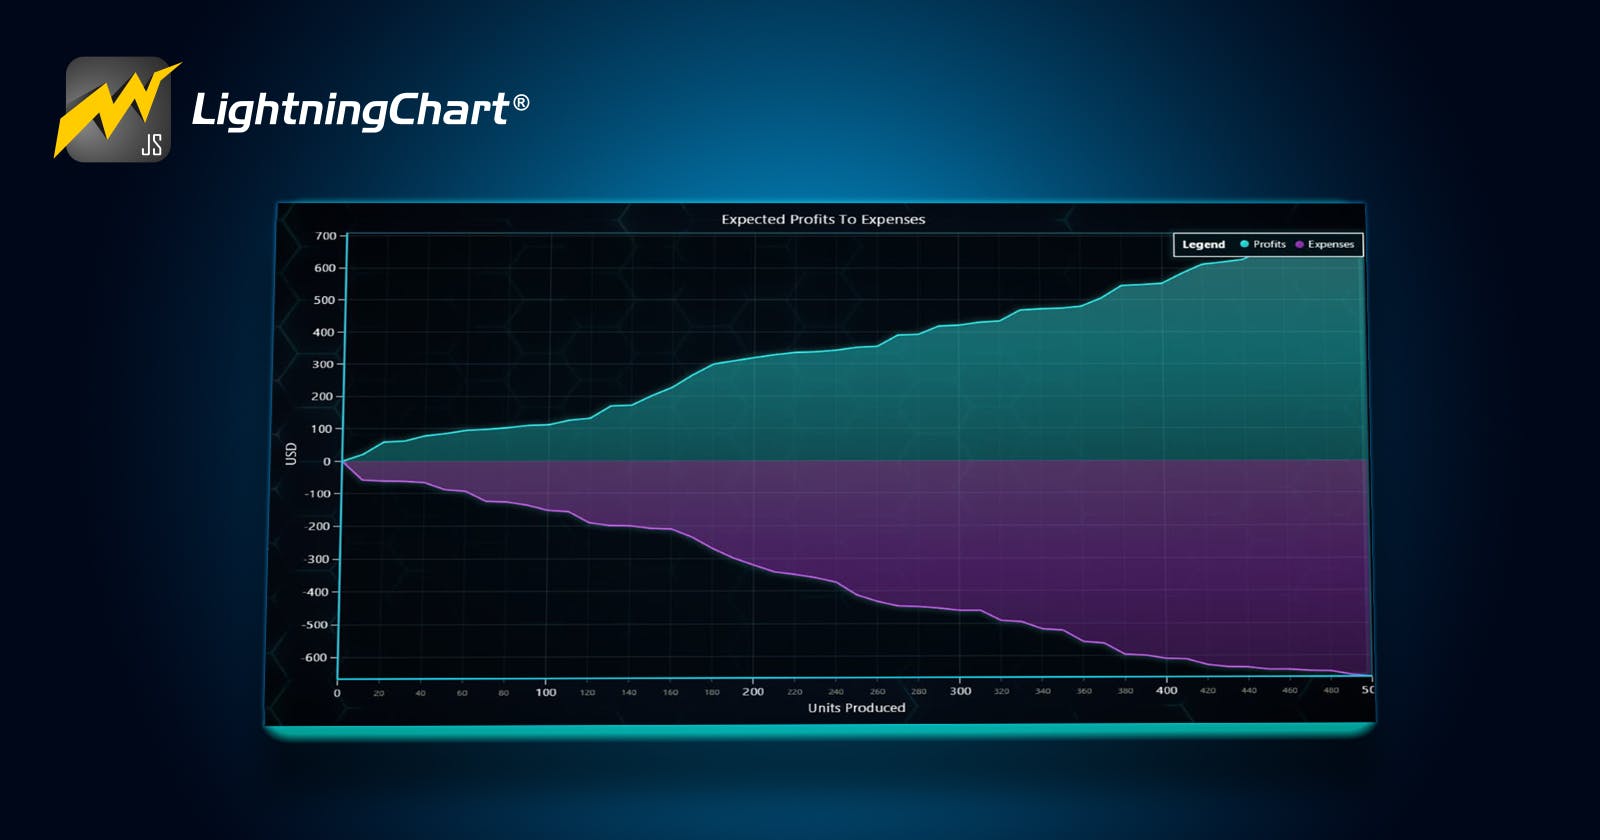
Omar Urbano | LightningChartlightningchart.hashnode.dev·Apr 8, 2024Creating a JavaScript Multiple Areas Chart with LightningChart JSFor my second article in Hashnode, I will create a Multiple Areas Chart using Node JS and Lightning Chart JS. The finished project can always be downloaded separately, and you can freely use and customize it. You may see that a Multiple Area chart sh...Discusslightningchart
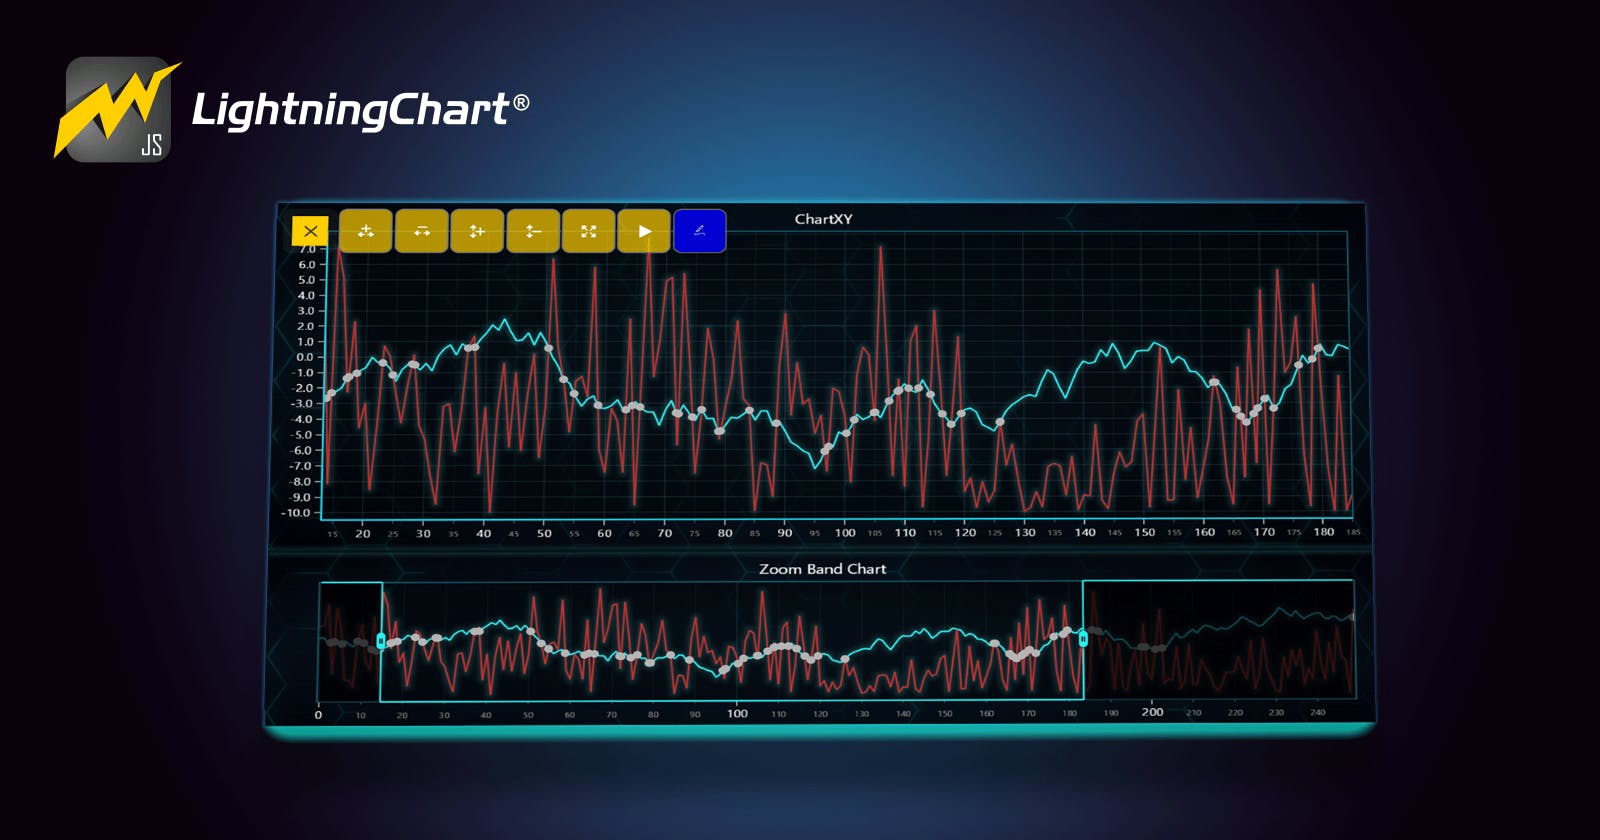
Omar Urbano | LightningChartlightningchart.hashnode.dev·Feb 29, 2024JS Charting Application with a UI On-Screen MenuHello! This is Omar Urbano from LightningChart. I recently discovered Hashnode and thought: why not share some content about high-performance charting libraries? In this article, I'll guide you through how to create a JavaScript chart application wit...Discuss·3 likes·36 readscharting library