Nida Zohradataden.hashnode.dev·Sep 1, 2024Data Vizualization: International Overdose Awareness DayIt is International Overdose Awareness Day today; which serves as a reminder of the lives lost to drug overdose and also that death due to overdose is preventable. Substances such as opioids, stimulants, alcohol, etc. are common causes of overdose re...DataVisualization
joshua osorojoshuaosoro.hashnode.dev·Dec 18, 2022Vector attribute manipulation of sf datalibrary(sf) library(rKenyaCensus) library(dplyr) Vector attribute data is non-spatial data associated with geographic data. We shall play with geographic data courtesy of rKenyaCensus library that represents census data of 2010. kenya_sf <- rKenyaCe...144 readsrstats
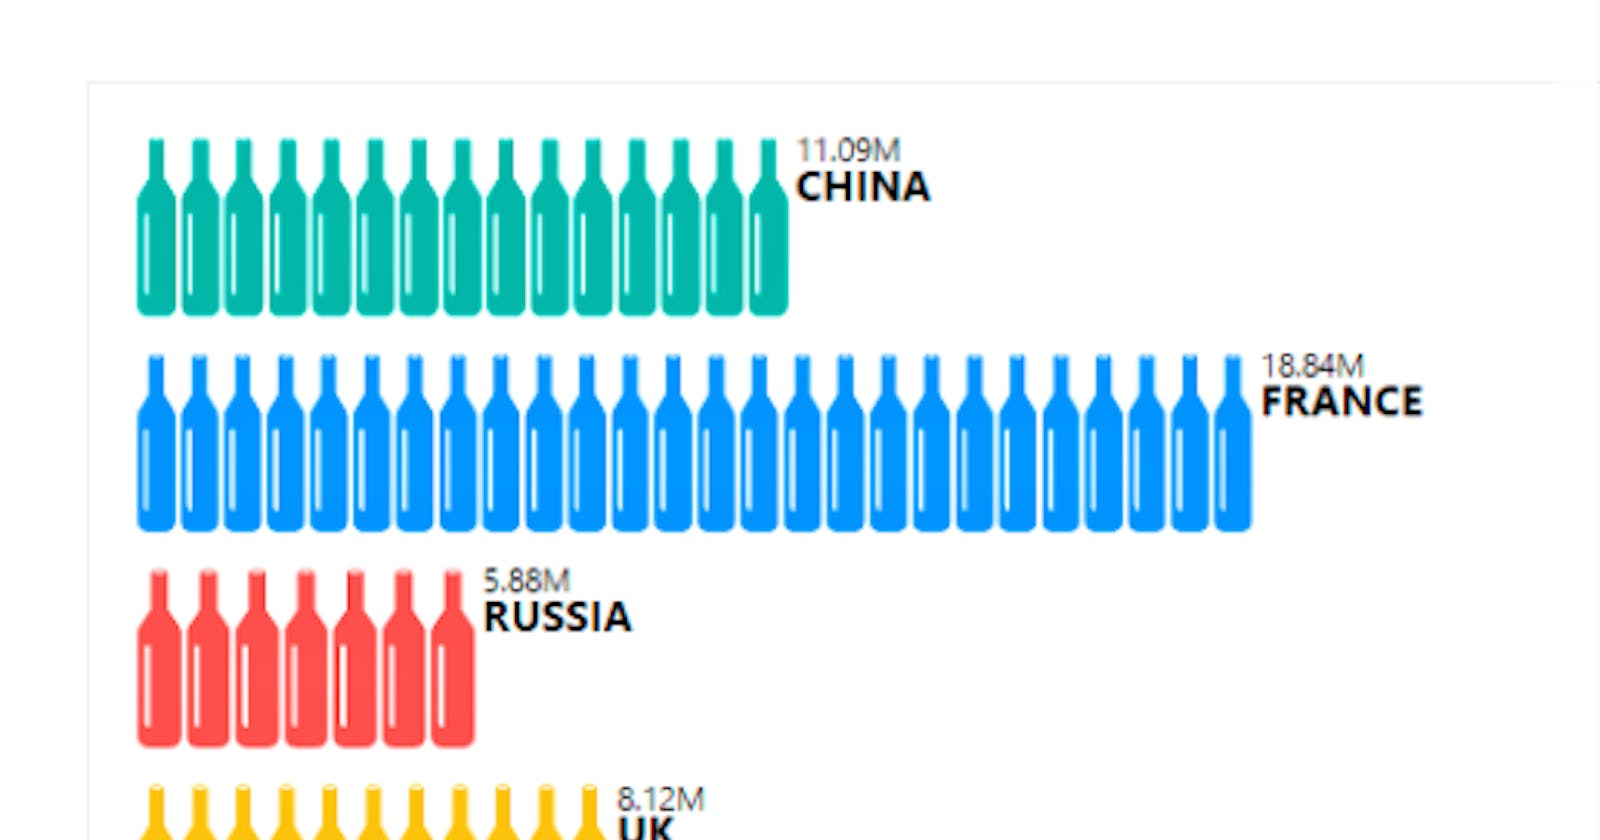
Yuliia Nikitinanikitina.hashnode.dev·Nov 18, 2022Announcing New Grid for instant work with Big Data: DataTable.dev!I’m 100% sure anyone who came across this post once had to deal with data analysis somehow. Mostly - with tables and tons of records there. I personally deal with them all the time, not just because I work in a company that develops pivot grids but ...42 readsDataVisualization
Kiite Koikitroubleshootbi.hashnode.dev·Jul 27, 20224 Custom visuals to use in Power BI to improve data visualizationThere are about 40 default (out-of-the box) visuals available for use in Power BI reports. There are more custom visuals available in the Microsoft Appsource and Power BI that have been created by Microsoft or Microsoft partners. These have been te...84 readsPowerBI
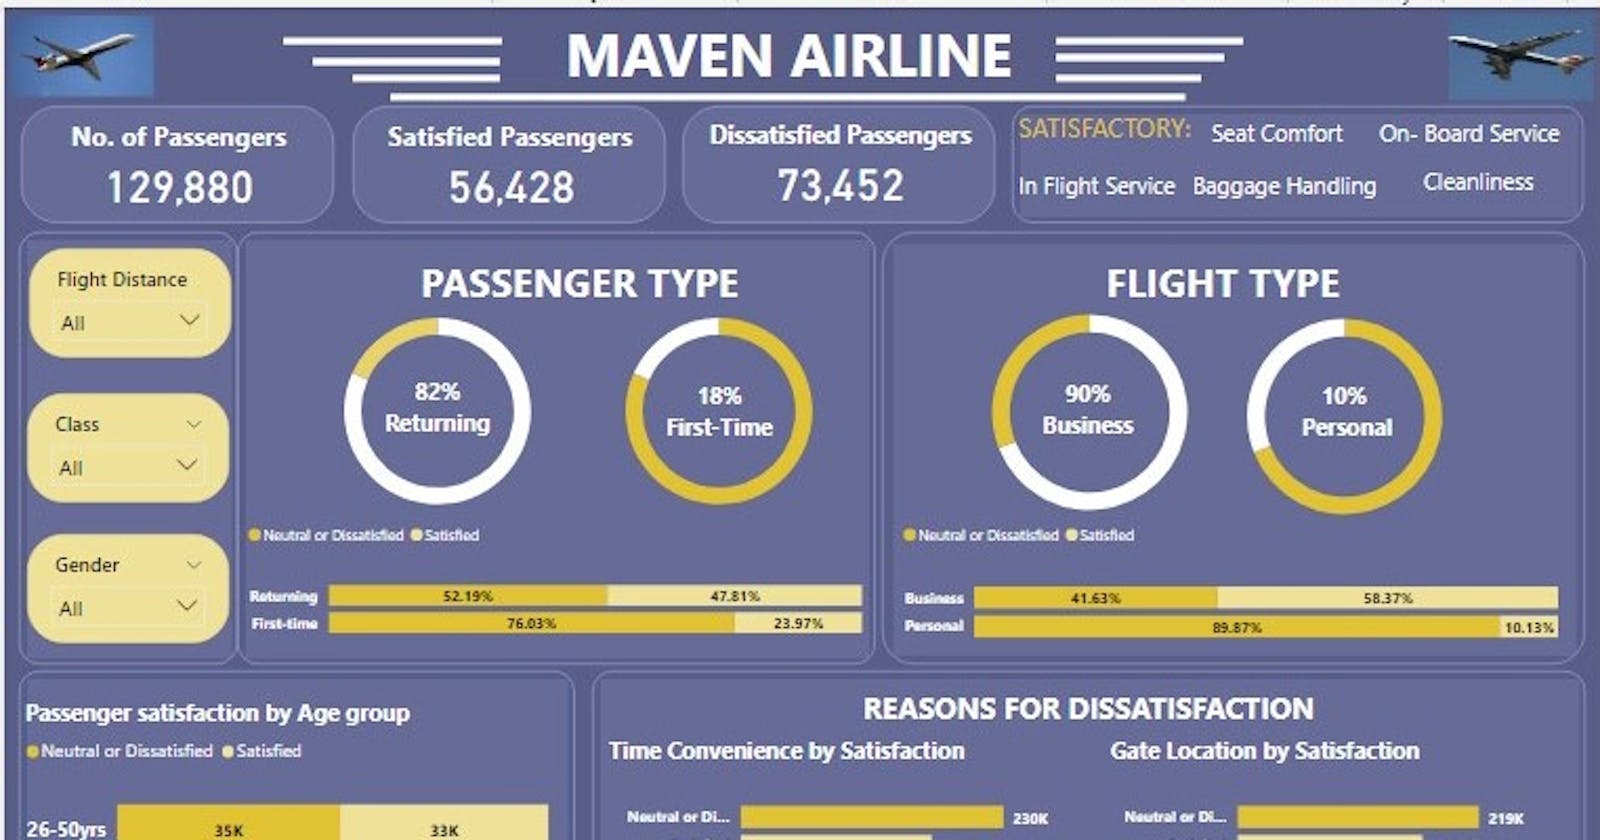
Data AnalyticsforDA12's team blogdataanalytics12.hashnode.dev·Jul 2, 2022Maven Airline AnalysisBackground It's the fourth week of the Side Hustle bootcamp, my team and I can't tell how insightful this past four weeks has been. I must say my team and I did a lot of researches and brain racking to the end that we meet up with the task for the we...118 readsdataviz
Jayahari Adithyatechspace.hashnode.dev·Jun 12, 2022Getting started with D3.js - A Javascript Data Visualization library.Hello guys, In this article, we will explore d3.js - A progressive Data Visualization library. WHAT IS D3.JS? D3 is a compelling framework in web development. It is an open-source JavaScript library used to manipulate documents based on data. It pro...5 likes·59 readsData Science
Obinna Okamgbaokams.hashnode.dev·Jun 10, 2022My analysis of telecoms subscriptions made in Nigeria in Q4 of 2018 using Power BIThe Task Data analysis has been an area of interest in recent times, according to Wikipedia, data analysis is a process of inspecting, cleansing, transforming, and modeling data with the goal of discovering useful information, informing conclusion...11 likes·181 readsdata