pallavi chauhaninnovateitworld.hashnode.dev·Nov 19, 2024Top Data Visualization Tools for Data Scientists in 2024Data visualization is a core skill for data scientists, enabling them to transform raw data into clear and actionable insights. It plays a vital role in storytelling and decision-making, making it an indispensable tool in the data science arsenal. As...DiscussSAS Visual Analytics
Gabriel Sacogsaco.hashnode.dev·Jul 30, 2024Aprende a graficar grandes volúmenes de datos con ggplot2R es un lenguaje de programación en constante crecimiento, cada vez más popular. Su popularidad ha crecido exponencialmente gracias a su capacidad para manejar grandes volúmenes de datos, realizar análisis estadísticos complejos y generar visualizaci...Discussggplot2
John MacKintoshjohnmackintosh.hashnode.dev·Jan 27, 2023Making headlinesIn my current mammoth work project, I’m generating many plots. The titles are very descriptive (they tell you what the plot is about), but they are not really telling a story. That's simply because there are so many on the production line. What we’d ...DiscussR Language
Devendra Chauhandevendra-chauhan.hashnode.dev·Feb 11, 2022How to make quick and easy charts with ggplot2Data visualisation is a very important aspect of the data analysis workflow. It is the point where a data analyst interact with the stakeholders and present their finding to them and Good Visuals helps the stakeholder to grasp your data in an easy an...Discuss·33 readsData Analysis in RR Language
Devendra Chauhandevendra-chauhan.hashnode.dev·Feb 4, 2022Tidyverse: A little universe for AnalystsYes, you heard it right. Tidyverse is a little universe on its own when it comes to data analysis. Let’s explore why it is so. How does Wikipedia define data analysis? Data analysis is a process of inspecting, cleansing, transforming, and modeling d...Discuss·28 readsData Analysis in Rtidyverse
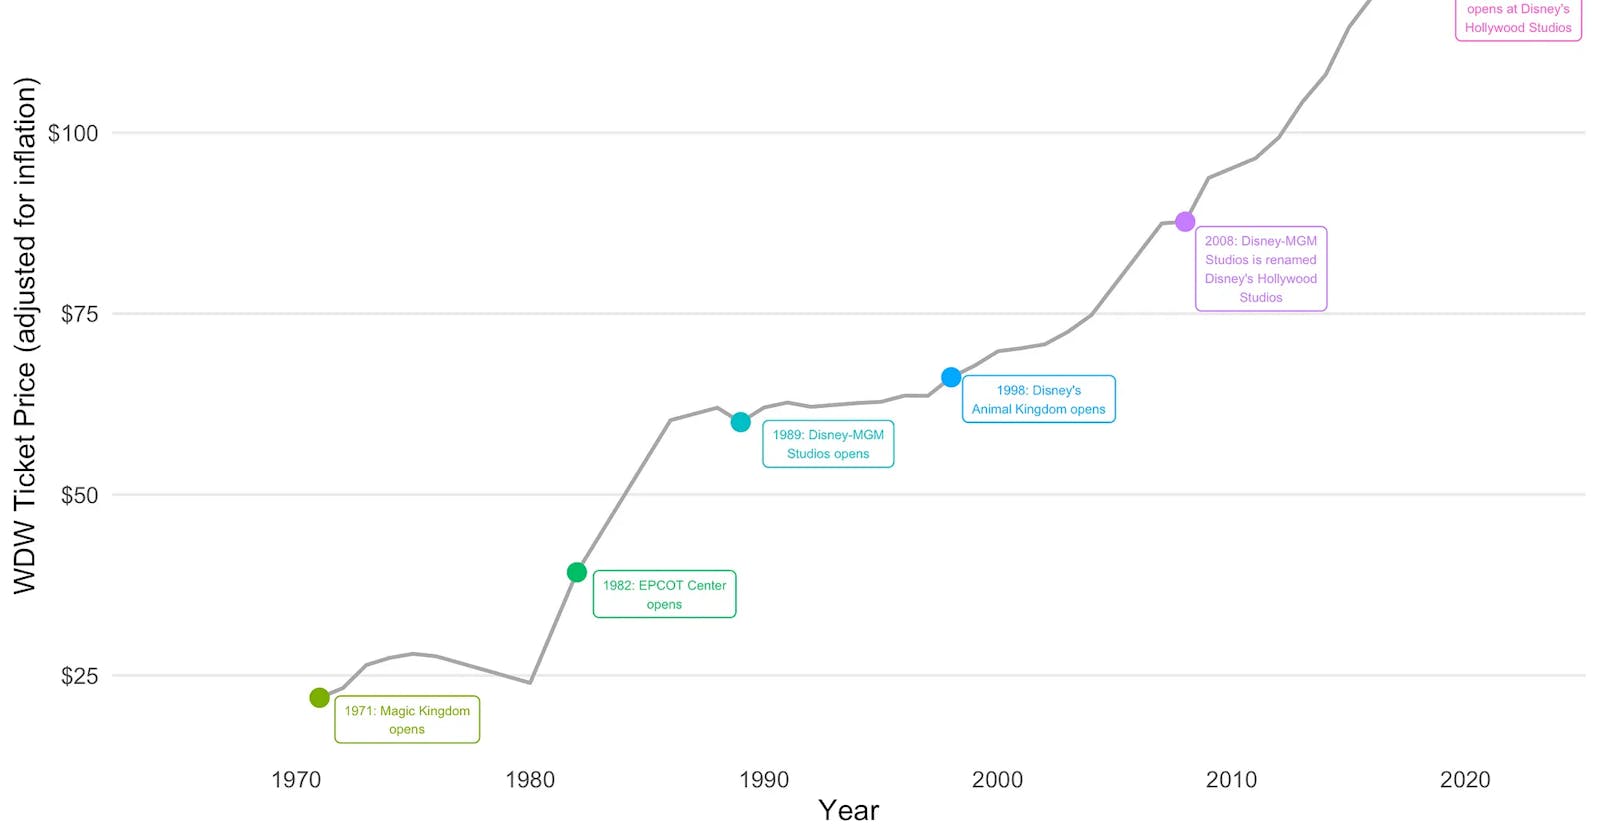
Ben Katesbenkates.hashnode.dev·Sep 17, 2019Enrich Your Data: Build Your Own Dataset Through Web Scraping and Other SourcesThis post has been reposted from the CompassRed blog You can easily increase the business value of your existing data by gathering and joining publicly available information from the web. Let’s walk through two web scraping examples through the lens ...Discuss·27 readsweb scraping
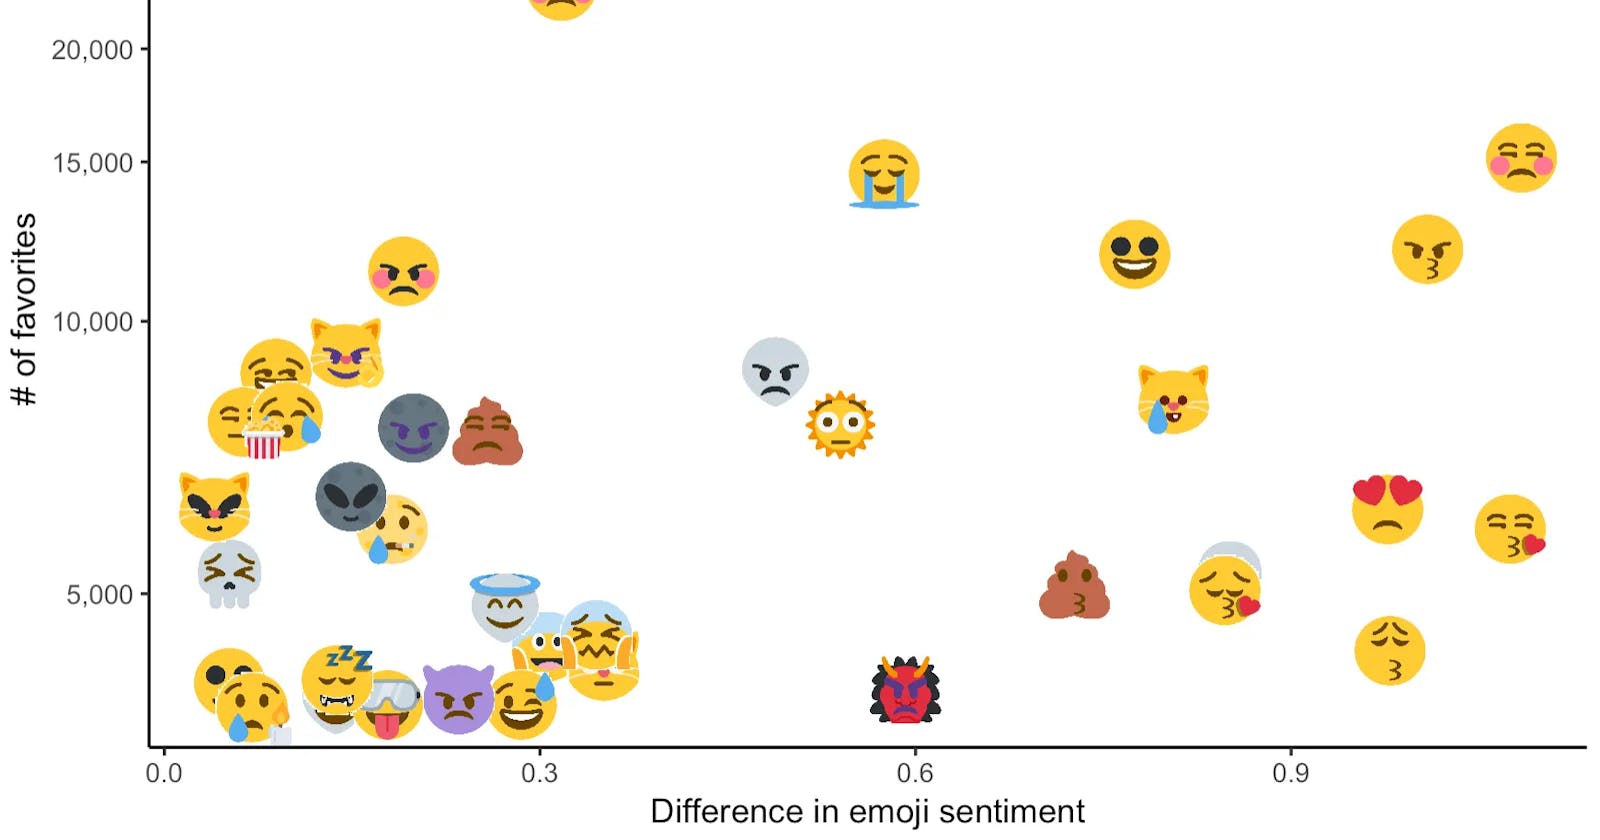
Ben Katesbenkates.hashnode.dev·Aug 13, 2019Makeover Monday: Visualizing the Emoji Mashup Twitter BotThis post has been reposted from the CompassRed blog For this week’s Makeover Monday data visualization exercise, I downloaded tweets from the increasingly popular Emoji Mashup Bot. This Twitter bot takes two emojis and creates a mashup between the t...Discuss·31 readsR Language