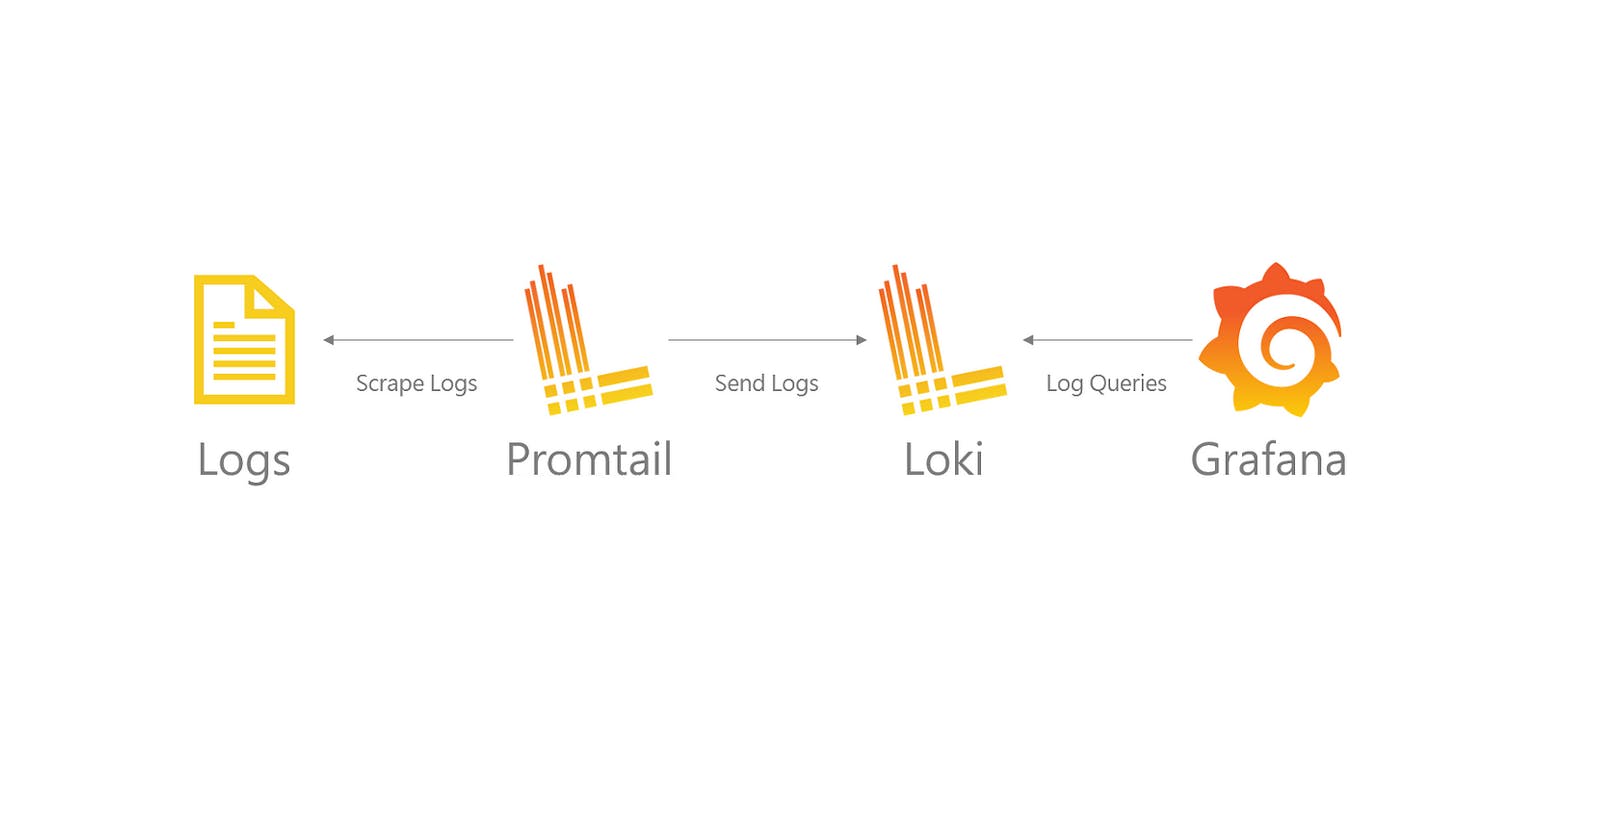
Kshitija Bartakke-Malwadekshitijaa.hashnode.dev·Feb 23, 2024Streamlining Log Monitoring: Building a Dashboard with Grafana, Loki, and PromtailIntroduction: In today's fast-paced digital landscape, effective log monitoring is essential for ensuring the reliability, security, and performance of software applications and infrastructure. Traditionally, managing logs across distributed systems ...Discuss·1 like·157 readsGrafana
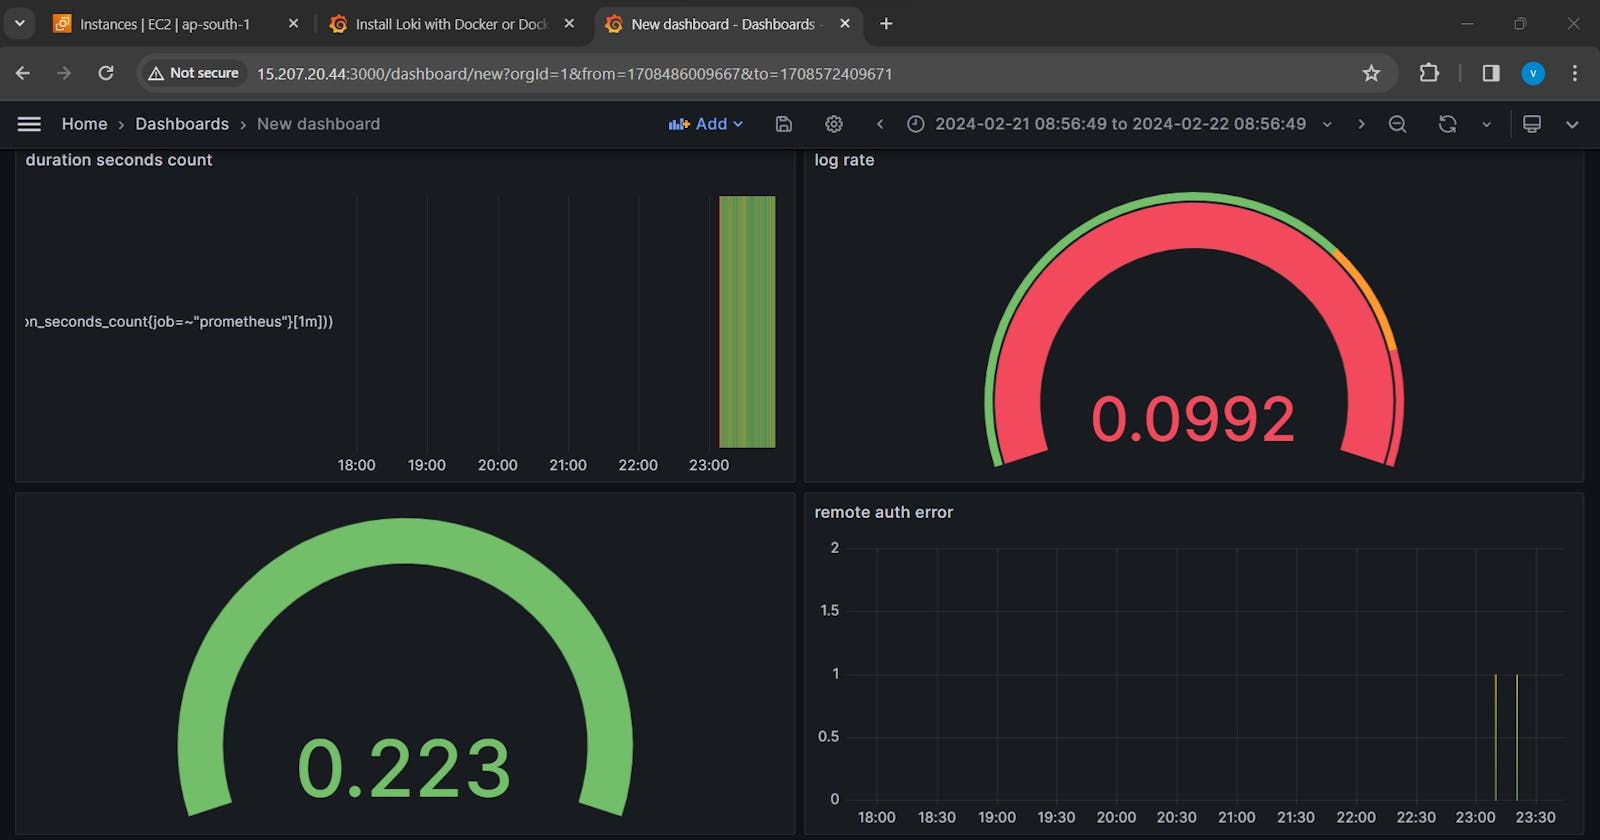
Vishal Shekokardevopsblogsbyvishal.hashnode.dev·Feb 21, 2024Unveiling the Power of Dashboards: A Step-by-Step Guide Day - 76Introduction: In the fast-paced world of data analytics, having a tool that provides a comprehensive view of your data is invaluable. Dashboards serve as the go-to solution for professionals seeking to track metrics and gain insights through visually...Discusssyslogs
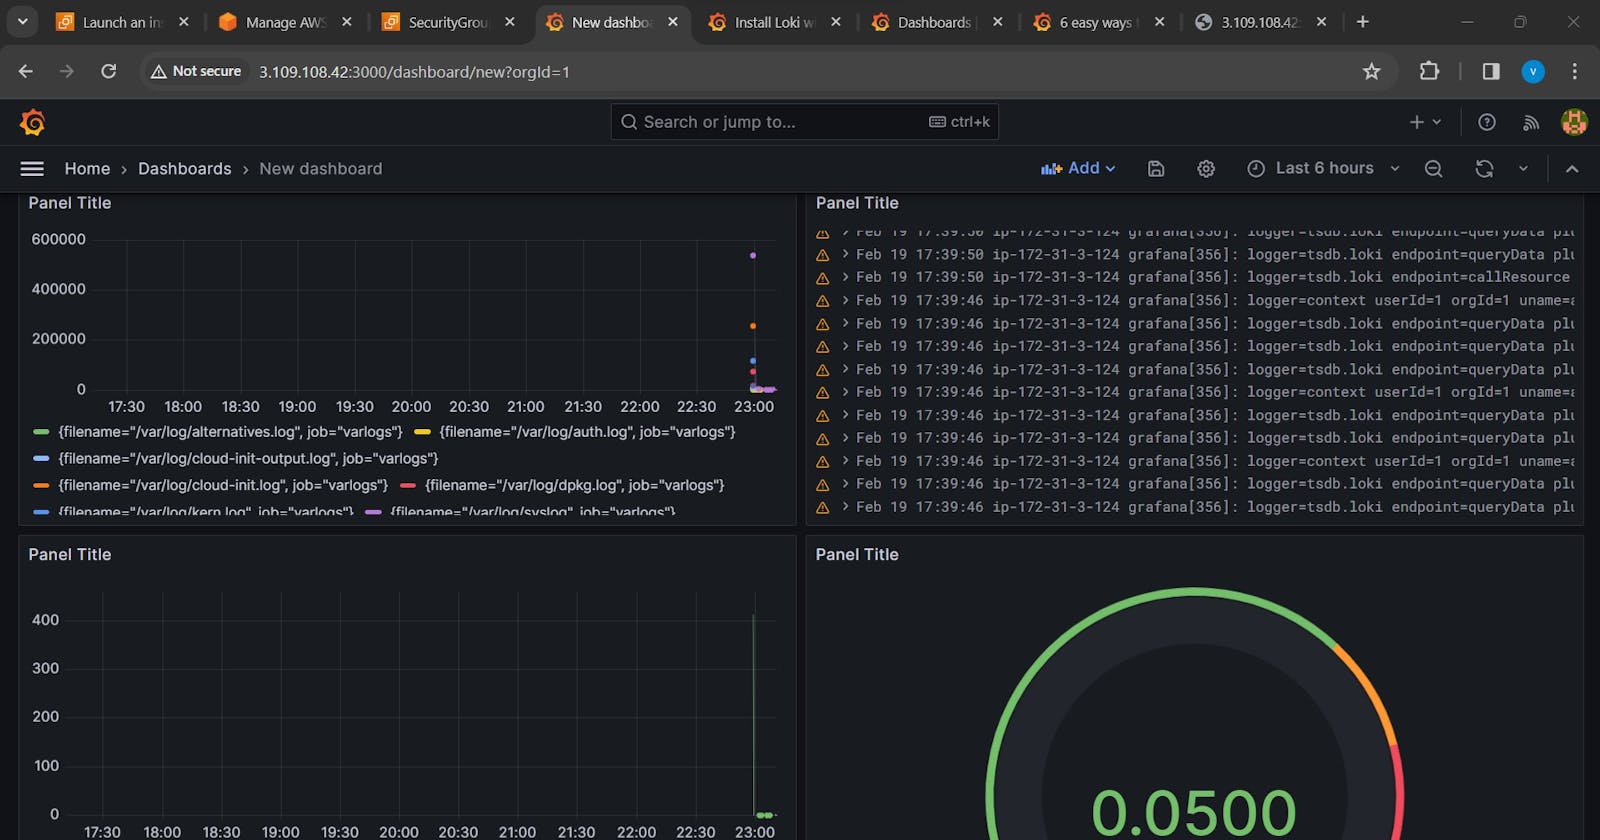
Vishal Shekokardevopsblogsbyvishal.hashnode.dev·Feb 19, 2024🚀 Supercharge Your Monitoring: Unleashing Grafana with Loki and Promtail on an EC2 Adventure! 🔍 Day - 74Introduction: Hey Rockstar Techies! 🌟 Yesterday's Grafana setup on your local machine was pure fire! 🔥 Now, are you ready to crank it up a notch and take your monitoring game to the cloud? Today, we're embarking on an epic journey - connecting a Li...Discuss#90daysofdevops
Vedant Thavkarveddevopsblog.hashnode.dev·Feb 15, 2024Day 90: End Of the Challenge 🚀Introduction: As I sit down to pen my thoughts on this remarkable journey, I'm filled with a sense of pride and accomplishment. Today marks the culmination of an incredible 90-day journey – an immersion into the dynamic world of DevOps. From day one,...Discuss·12 likes·161 readsDevopsDevops
Akash Singhakashblogs-1689395803240.hashnode.dev·Feb 7, 2024Day 75 - Sending Docker Log to GrafanaWe learned how to install and start Grafana, set up Loki and Promtail via Docker, and configure Loki as a data source in Grafana. Armed with these insights, you’re now well-prepared to navigate the world of efficient data visualization and comprehens...Discuss·51 readsGrafana
Vedant Thavkarveddevopsblog.hashnode.dev·Feb 5, 2024Day 75: Building a Docker Monitoring Dashboard with Grafana, Telegraf, and InfluxDBIntroduction: Monitoring containerized environments is essential for ensuring the reliability, performance, and scalability of modern applications. In this tutorial, we will guide you through the process of setting up a comprehensive Docker monitorin...Discuss·10 likes·36 readsDevopsGrafana
Vedant Thavkarveddevopsblog.hashnode.dev·Jan 31, 2024Day 72: Exploring Grafana-A Comprehensive Guide to Monitoring and Visualization🔥Welcome, DevOps enthusiasts! Today, we delve into the world of Grafana – an indispensable tool for smart resource monitoring and visualization. Let's unravel the essence of Grafana, its features, advantages, supported monitoring types, compatible dat...Discuss·10 likesDevopsGrafana
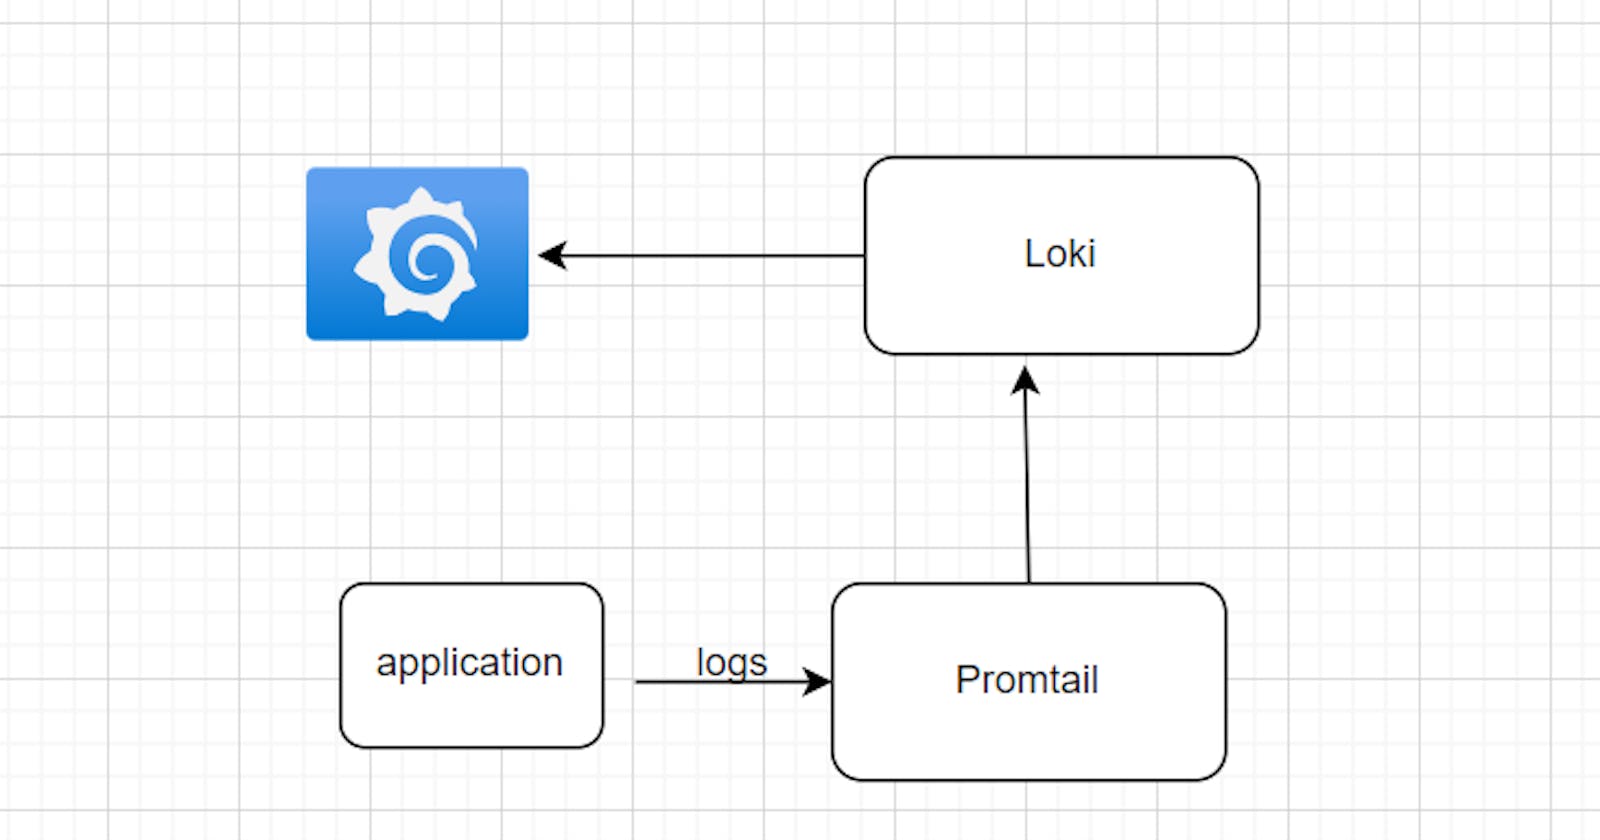
pardeep kaurpardeepkaur.hashnode.dev·Jan 30, 2024Streamlining Data Flow: Utilizing Promtail for Application Data Collection, Loki for Centralized Log Aggregation, and Grafana for Comprehensive VisualGrafana is an open-source analytics and monitoring platform used for creating customizable dashboards to visualize and analyze data from various sources. It supports integration with databases, cloud services, and monitoring tools, allowing users to ...Discussnaginx
Kishor Chavankishorc.hashnode.dev·Jan 21, 2024Connecting EC2 with GrafanaIn the last article, we have learned How to set up Grafana in our local environment. Now, let's do one step ahead. Task: Connect an Linux and one Windows EC2 instance with Grafana and monitor the different components of the server. For solution we ne...Discuss·1 like·58 readsec2
Rohan Balgotradevxblog.hashnode.dev·Jan 11, 2024Monitor Nginx with Grafana DashboardIntroduction: Welcome to Day 75 of #90daysofdevops! In today we'll be setting up a dashboard to visualize Nginx logs. Pre-requisites: Amazon EC2 Instance Ensure the availability of an Amazon EC2 instance to serve as the host for Docker containers...Discuss·184 readsGrafana