S. M. Arefin RumiforMy DevOps Blogarefinrumi.hashnode.dev·Oct 22, 2024Creating Scheduled Reports With ZabbixDEPLOYING AND CONFIGURING SCHEDULED REPORTS First, let's install and configure the zabbix-web-service component This component is responsible for generating scheduled reports First, let's deploy the zabbix-web-service package apt install zabbix-web...Discuss·53 readsZabbix
S. M. Arefin RumiforMy DevOps Blogarefinrumi.hashnode.dev·Oct 22, 2024Install and configure Zabbix 7.0 lts on Ubuntu 22.04.5 LTSA. Become root user Start new shell session with root privileges. sudo -s B. Install Zabbix repository wget https://repo.zabbix.com/zabbix/7.0/ubuntu/pool/main/z/zabbix-release/zabbix-release_7.0-2+ubuntu22.04_all.deb dpkg -i zabbix-release_7.0-2+ub...Discuss·30 readsZabbix
Sarthak Tyagiforsarthak's Blogsarthakwrites.hashnode.dev·Oct 14, 2024Zabbix Installation in Docker and AWS Integration GuideIntroduction This guide will walk you through the process of installing Zabbix using Docker Compose and integrating it with AWS services. Prerequisites Latest Docker and Docker Compose installed on your machine. AWS account with necessary permissi...DiscussZabbix
Indramani Sharmaforindramani264.hashnode.dev·Sep 15, 2024Zabbix as a Monitoring ToolZabbix is an open-source monitoring tool designed to track the performance and availability of IT infrastructure, such as servers, virtual machines, network devices, and more. It is widely used in enterprises for real-time monitoring and alerting. He...DiscussZabbix
Fernando Muller JuniorforDevOps Minddevopsmind.hashnode.dev·Jul 30, 2024Como Monitorar o Selenium Usando Zabbix: Guia CompletoIntrodução Você está enfrentando dificuldades em monitorar seu Selenium? Isso pode ser frustrante, especialmente quando você precisa garantir que tudo esteja funcionando perfeitamente. Não se preocupe, temos a solução! Neste guia, vamos mostrar como ...DiscussZabbix
Fernando Muller JuniorforDevOps Minddevopsmind.hashnode.dev·Jul 29, 2024Comprehensive Guide to Zabbix API: Integration and AutomationIntroduction Are you struggling to manage and automate your IT infrastructure effectively? The Zabbix API offers a powerful solution to integrate, automate, and customize your monitoring setup. In this guide, we will delve into the Zabbix API, explor...Discuss·60 readsZabbix
Mahdi ShadiforMahdi Shadimahdishadi.me·Apr 18, 2024Monitoring internet Speed with Zabbix and GrafanaZabbix is an open-source monitoring software tool used for monitoring diverse IT components, including networks, servers, virtual machines, and cloud services. It's designed to provide real-time insights into the performance and availability of vario...Discuss·1 like·161 readsZabbix
Prahlad InalaforToolMate Blogprahladinala-1679763631201.hashnode.dev·Oct 2, 2023Zabbix: Monitoring and Managing IT Infrastructure with Efficiency and PrecisionIntroduction to Zabbix Zabbix is an open-source enterprise-level monitoring tool designed to track the performance and health of IT infrastructure components. It was created by Alexei Vladishev in 2001 and has since become one of the most widely used...DiscussDevOpsZabbix
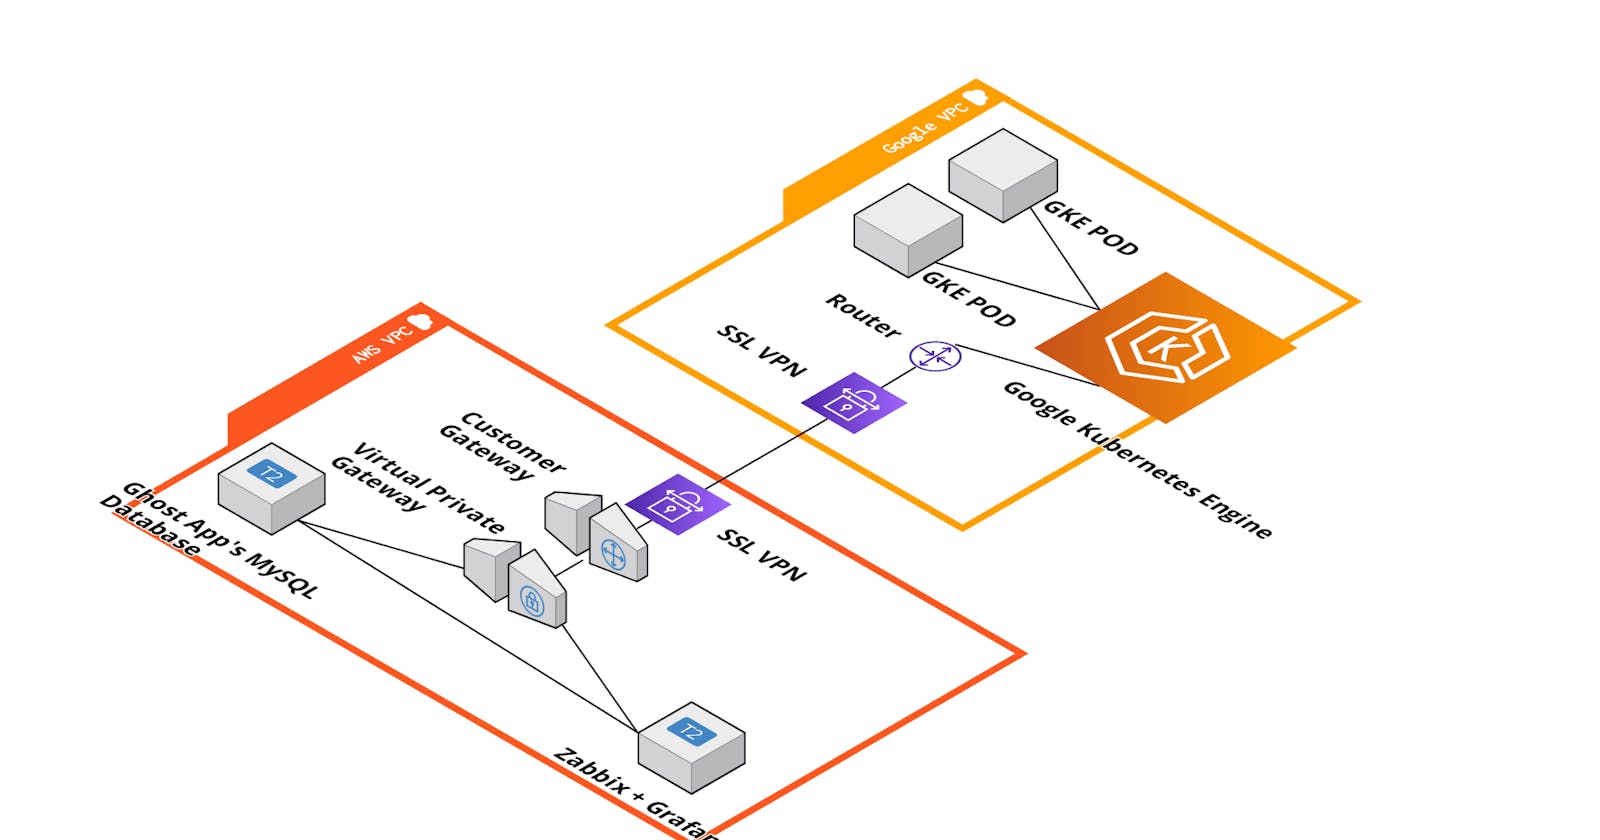
Nachiket SarodeforNachiket's Tech Blogsnachiketvsarode.hashnode.dev·Jun 29, 2023Hosting a Blogging Application in a Multi-Cloud platformThis is the First time that I am blogging, hashnode has provided this wonderful platform to blog. This is a demonstration of hosting a blogging application "Ghost" on the managed Kubernetes - GCP's GKE. The end goal of this blog is to represent how I...Discuss·195 readsKubernetes
yogesh janwadeforhashbrown.hashnode.dev·Jun 8, 2023Monitoring ToolsAPICA Apica WebPerformance is a synthetic monitoring platform. It features pre-release and scalability testing and can integrate with other reporting and analysis programs. The Apica platform offers a controlled environment where you can reduce false...Discuss·35 readsmonitoring