Create, collaborate, and scale your blogs and docs.
Effortlessly build blogs, API docs, and product guides with Hashnode, with the flexibility of a headless CMS and more.
No credit card required.

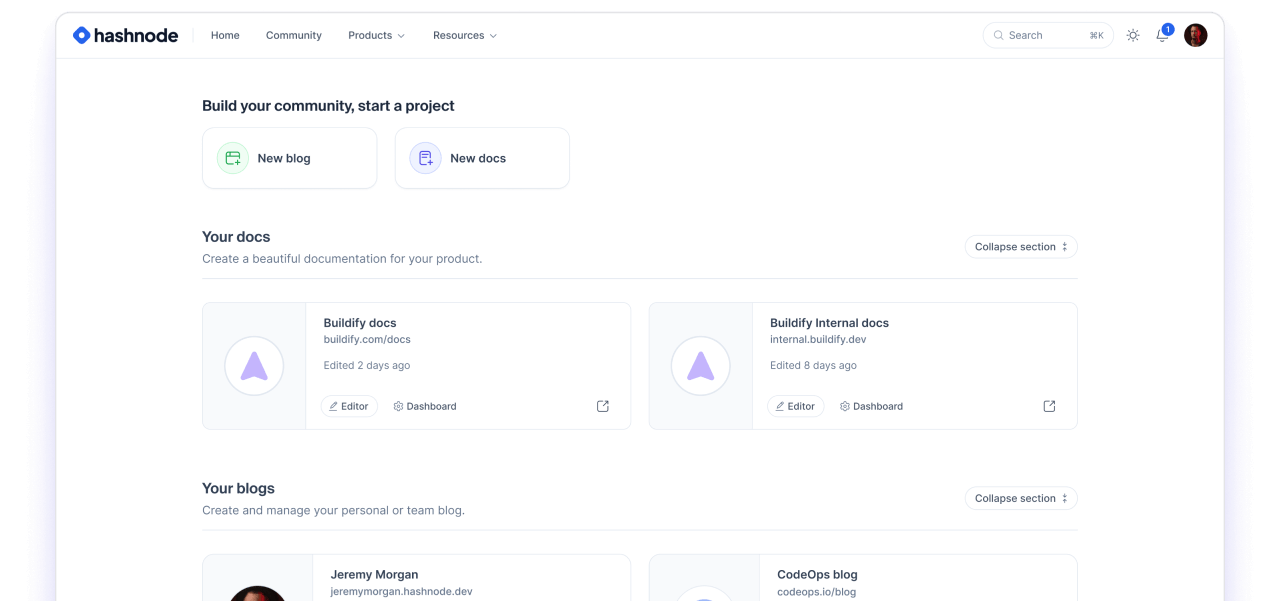

Trusted by top engineering teams worldwide.
The modern content engine for API docs and product guides.
Create and scale dynamic developer docs and API references. Built for teams needing full control and customization — no heavy lifting, no upkeep, no reinventing the wheel.
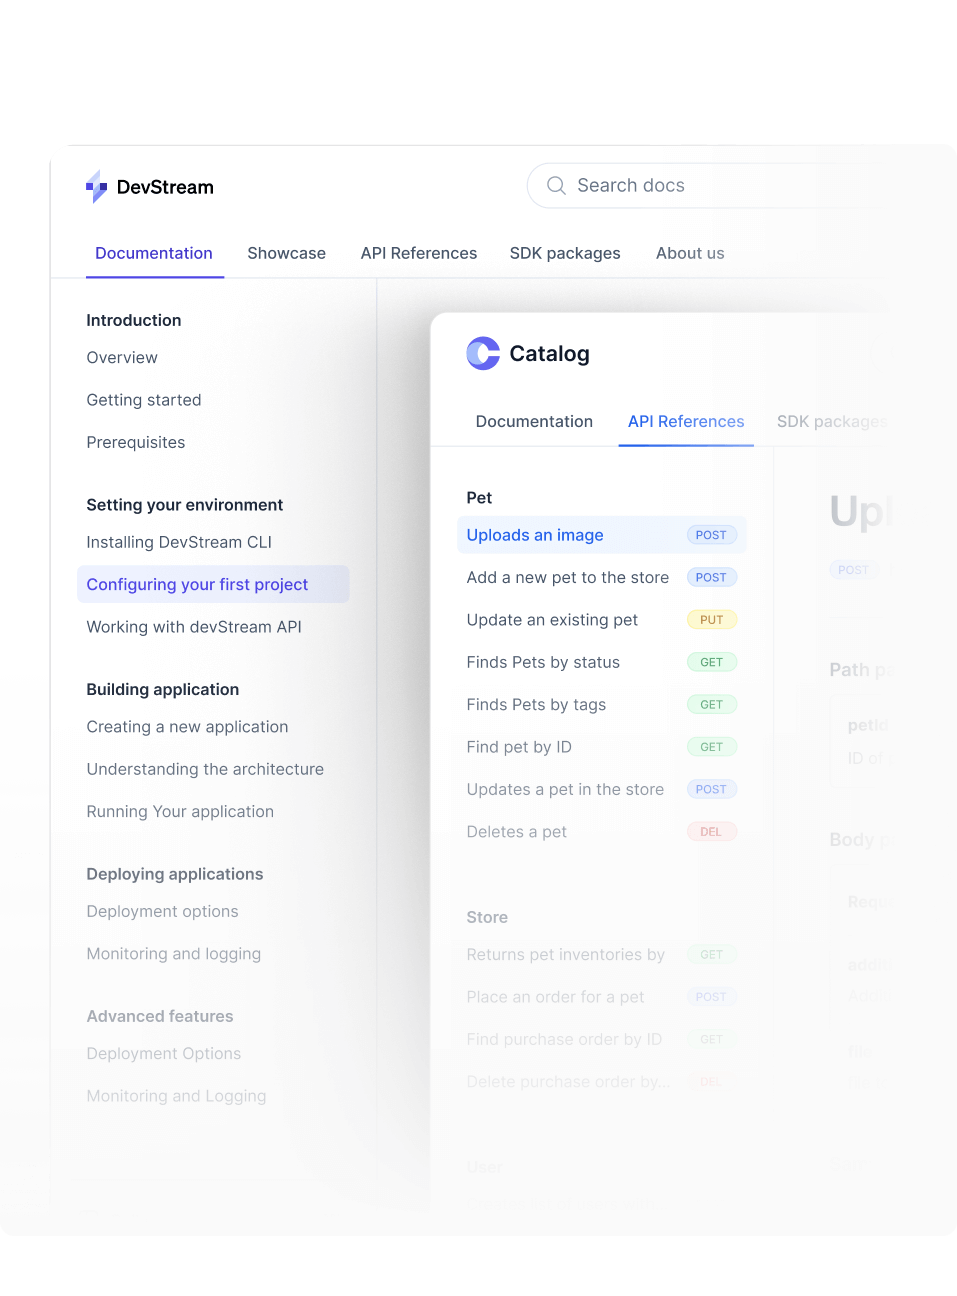
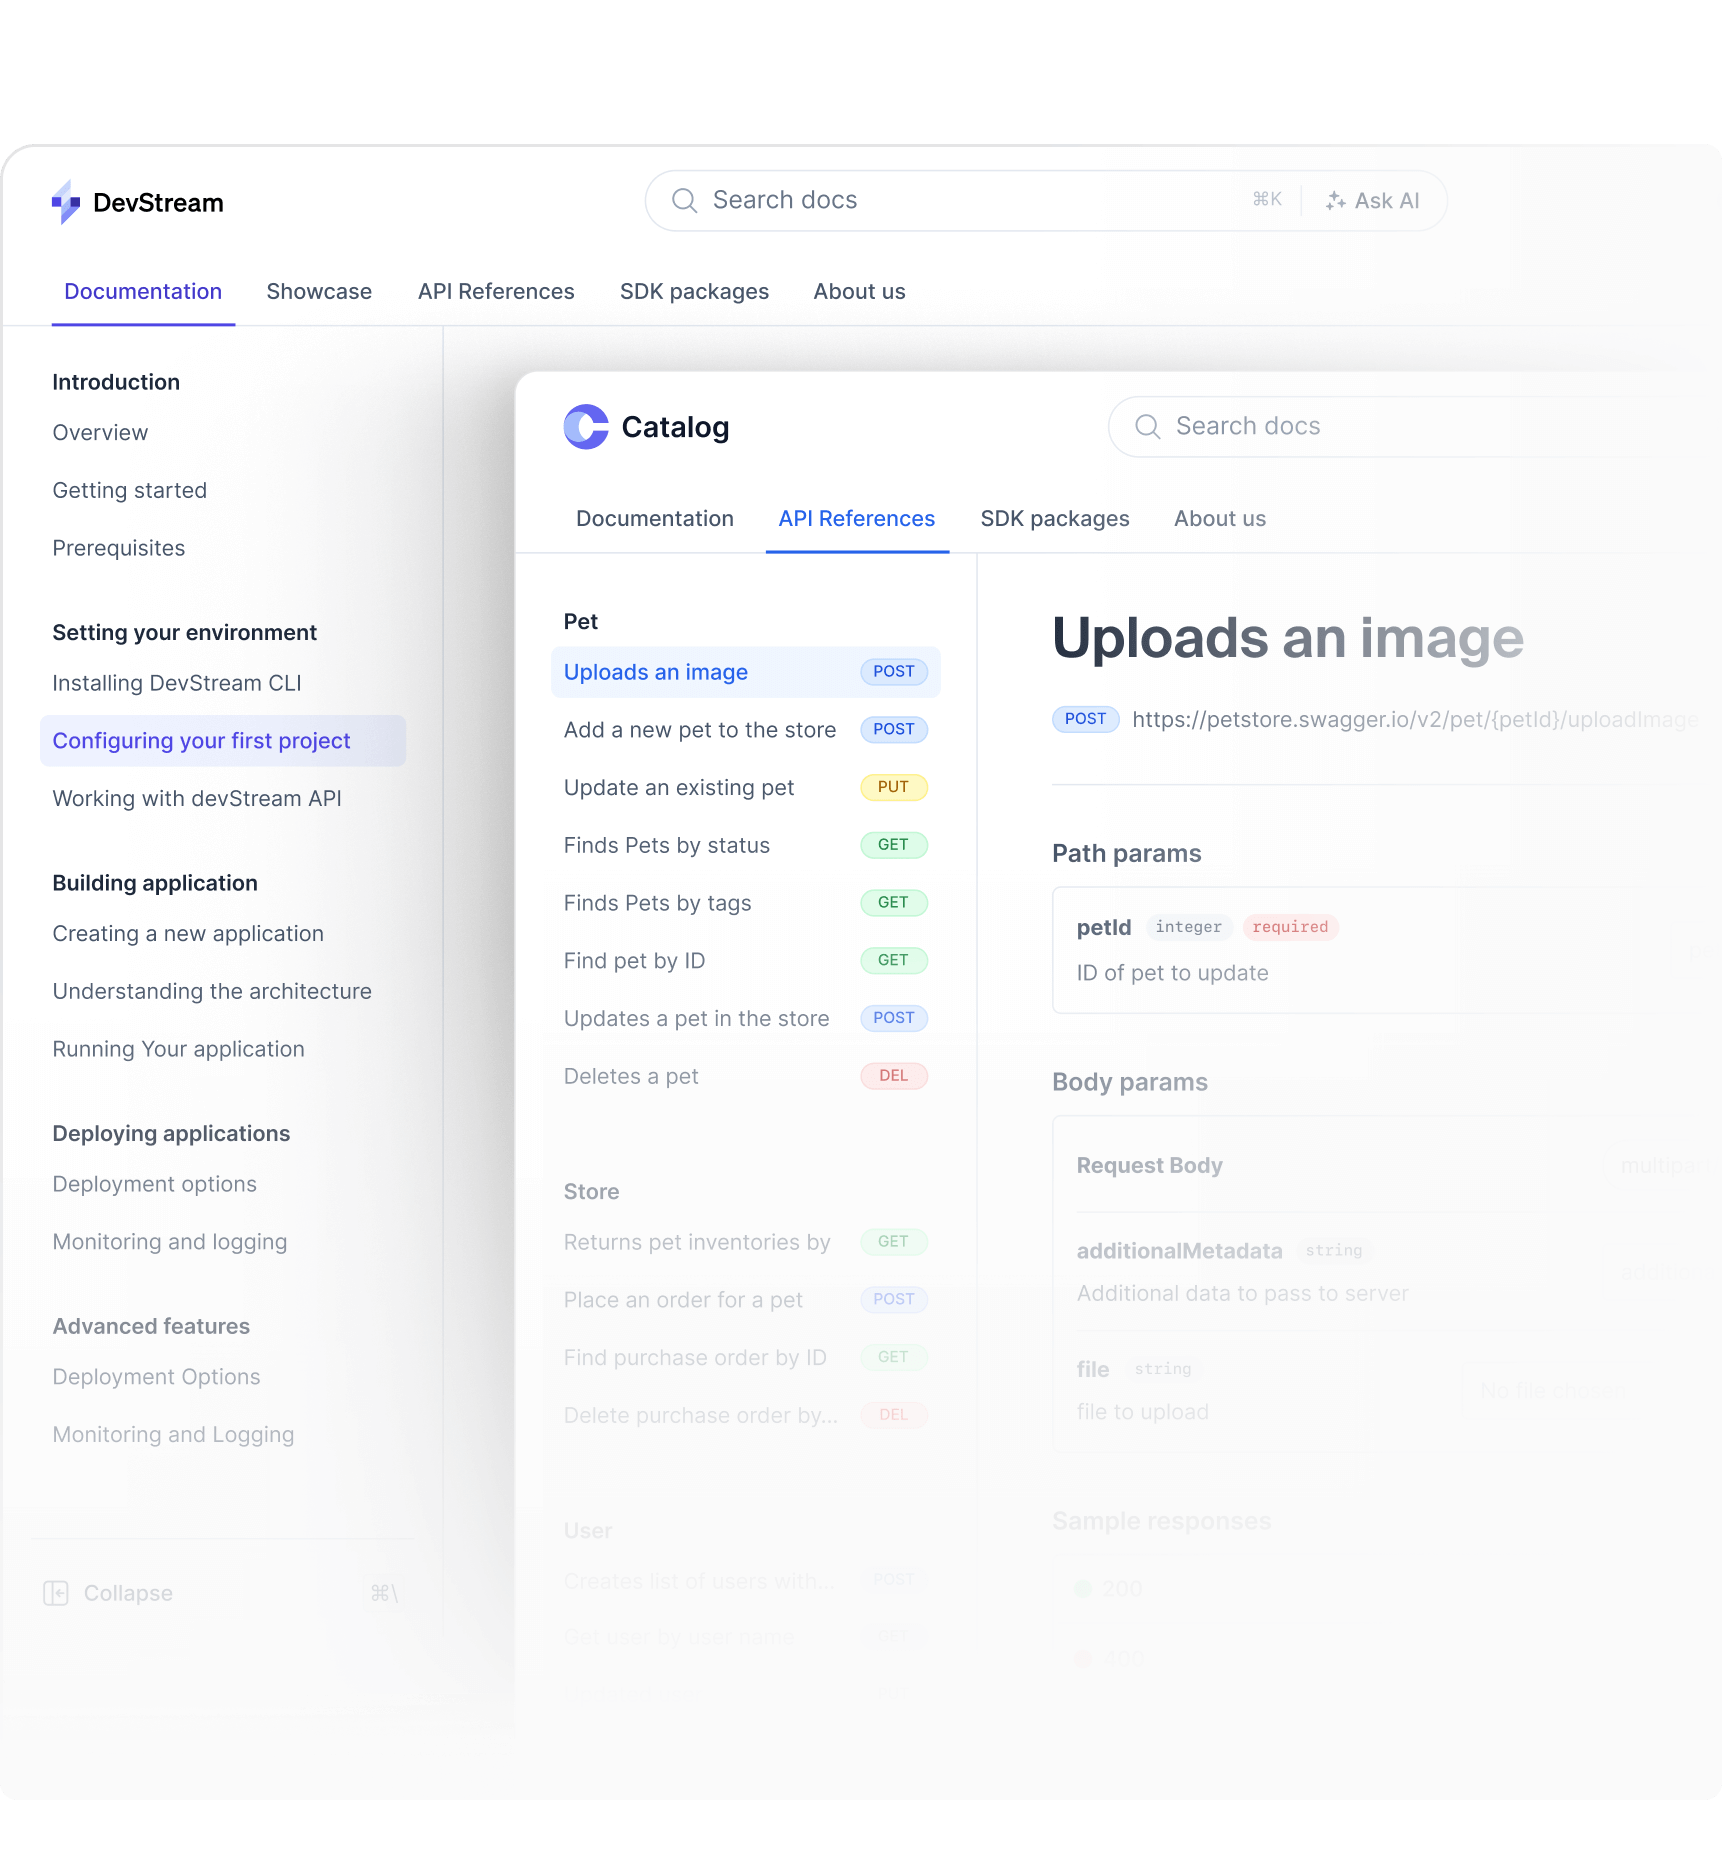
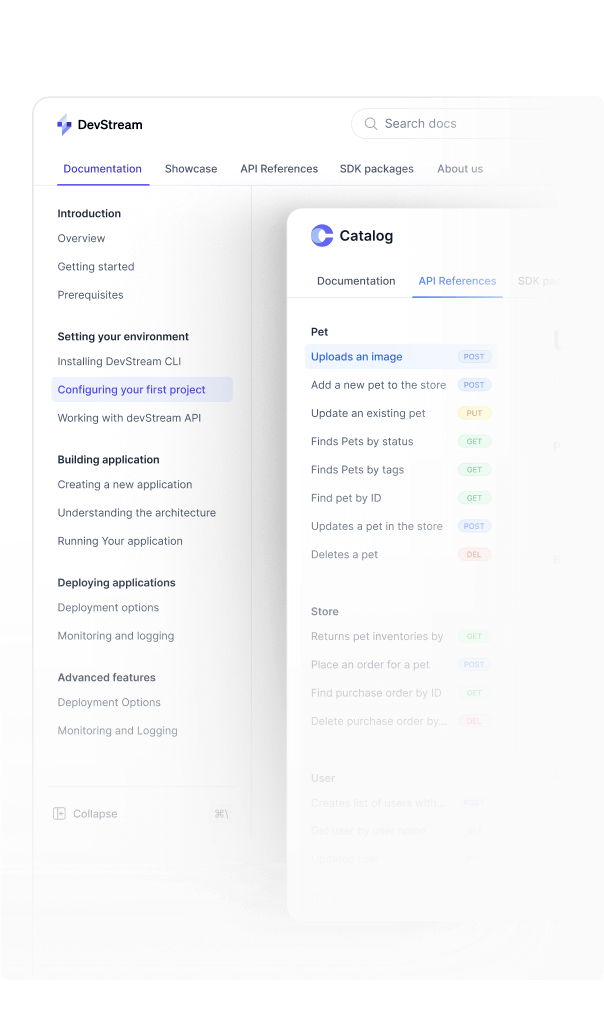


Unlimited guides and API references in a single project.
Use custom domains and sub-paths.
Go headless and fully customize the UI to match your brand.
Sync with GitHub for open-source contributions.
Collaborate easily — involve the entire team, not just developers.
“Hashnode's doc creation and collaboration tool is 10x easier, with a top-tier editor and beautiful UI—excited to launch alongside their release!”
Brandon Strittmatter
Co-Founder & CEO, Outerbase
The best blogging platform for developers and teams.
Effortlessly run your blog, solo or with a team. Customize everything — map a domain, subdomain, or use a company sub-path. Already loved by millions of devs worldwide.


Block-based WYSIWYG Markdown editor.
Map custom domains and sub-paths like /blog.
Go headless and fully customize the UI to match your brand.
SEO-optimized and lightning-fast out of the box.
Collaborate with your team — inline comments, real-time editing.
“The freeCodeCamp community makes heavy use of Hashnode's publishing workflow to collaborate on books and tutorials. This has boosted our productivity and saved us a ton of time.”
Quincy Larson
Founder, FreeCodeCamp
The AI-powered content stack for everyone on your team.
Hashnode's AI tools help your team move quickly to deliver docs and blogs that your users will love. Built-in features to make your team 100x more productive.
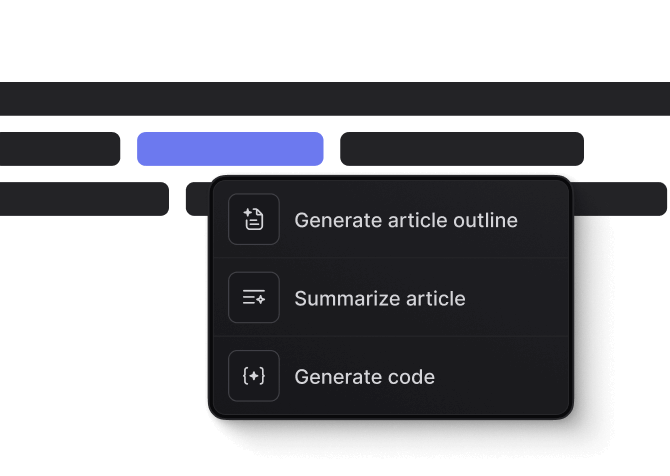
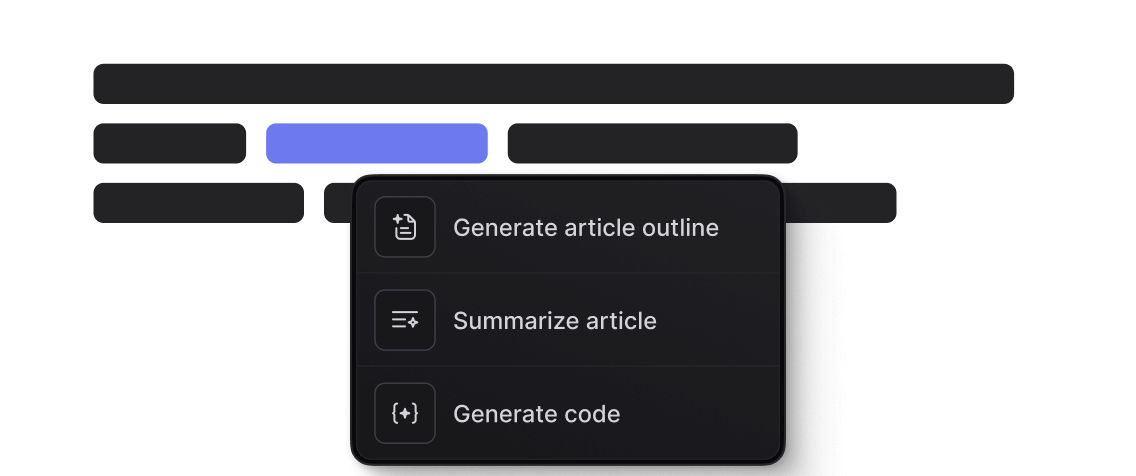
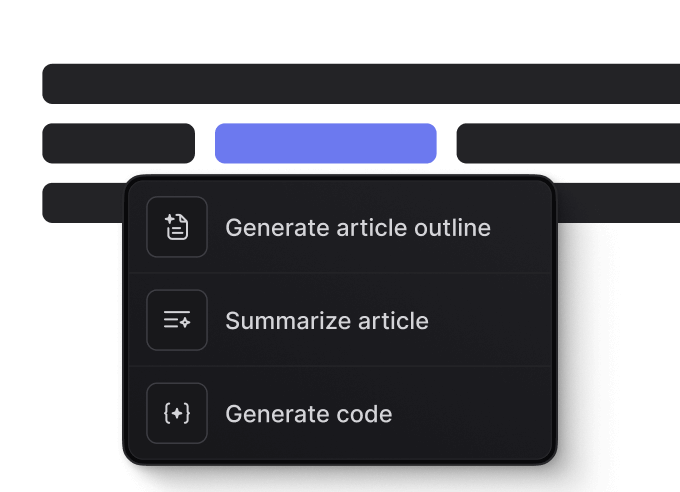
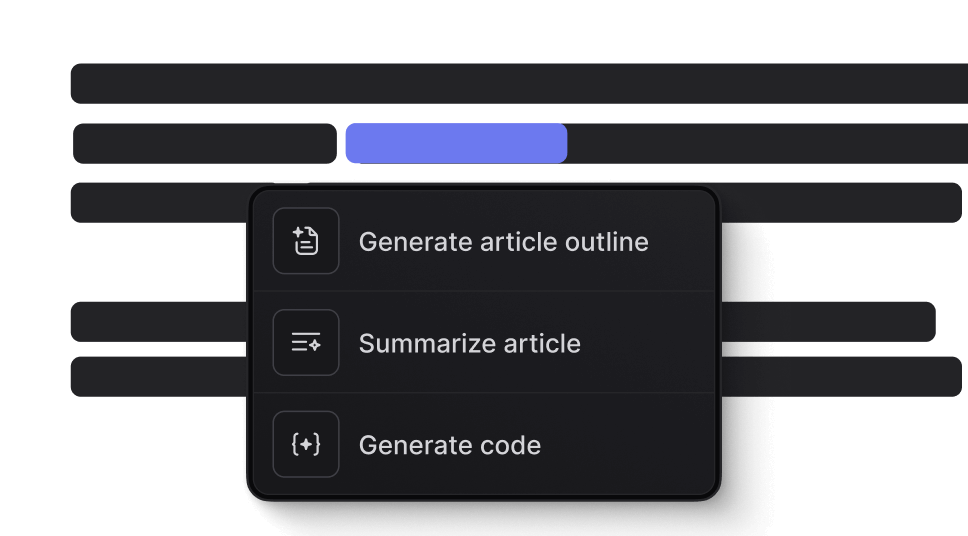

AI-assisted writing tools.
Generate polished content, rephrase to fit your brand's voice, and research topics — all within the editor.


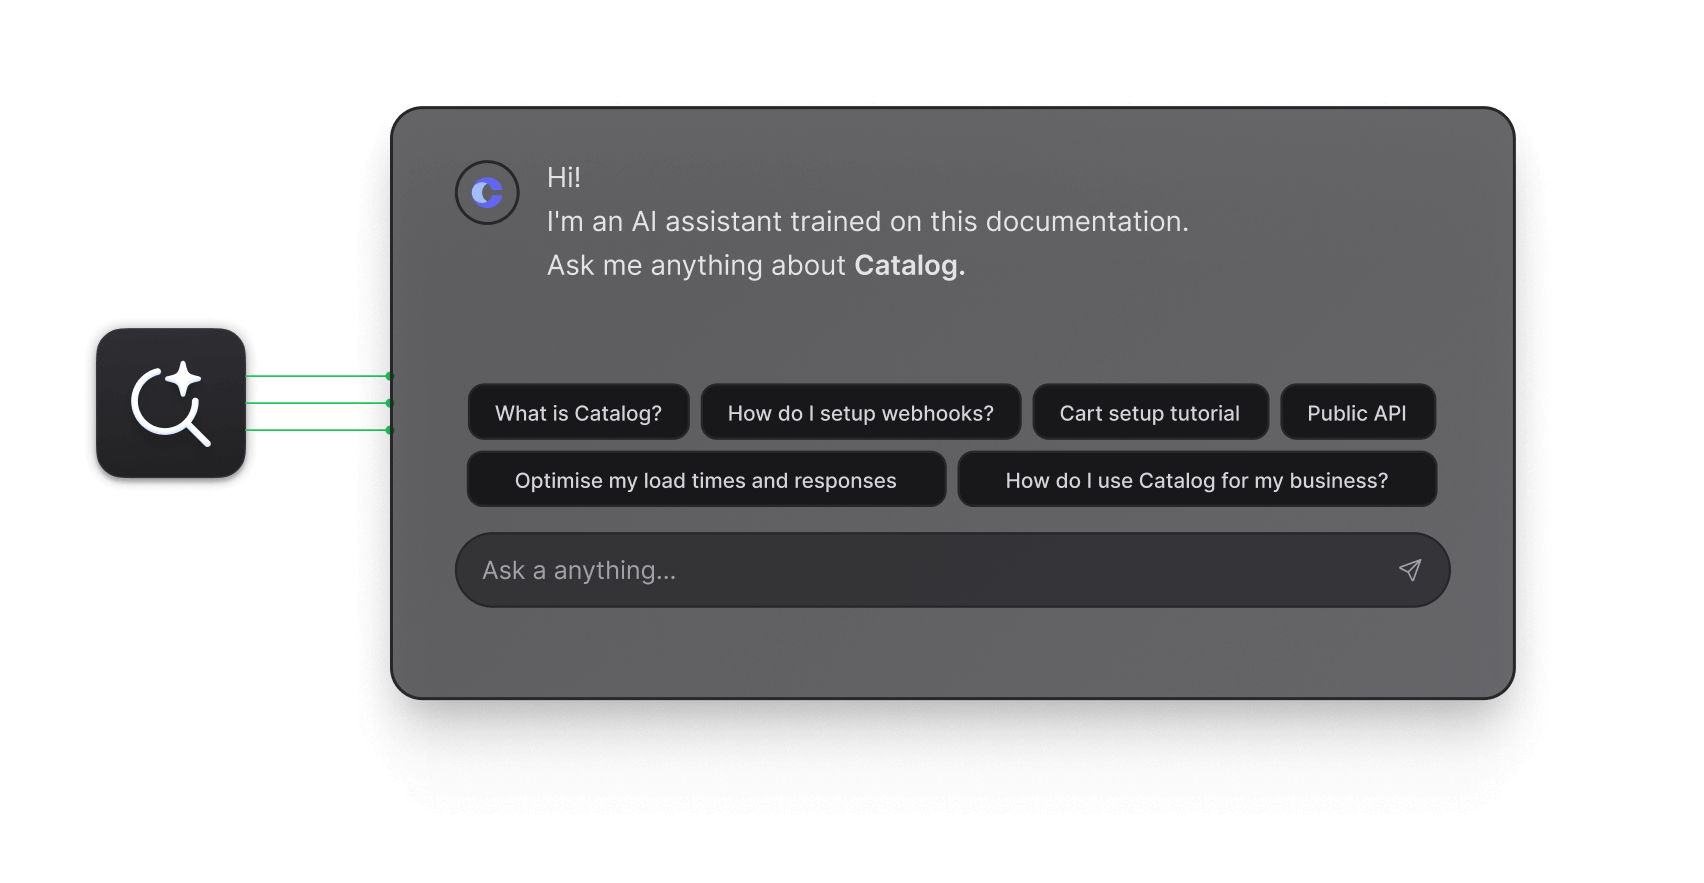
AI-powered docs search.
Deliver the right answer to your users with Hashnode's AI-driven chat search. It searches through guides, endpoints, and API reference examples.

AI-sidekick.
A ChatGPT-like assistant built into the editor, helping your team get more from their drafts. Turn articles into tweets, find info from the web—it understands the full context of what's written.
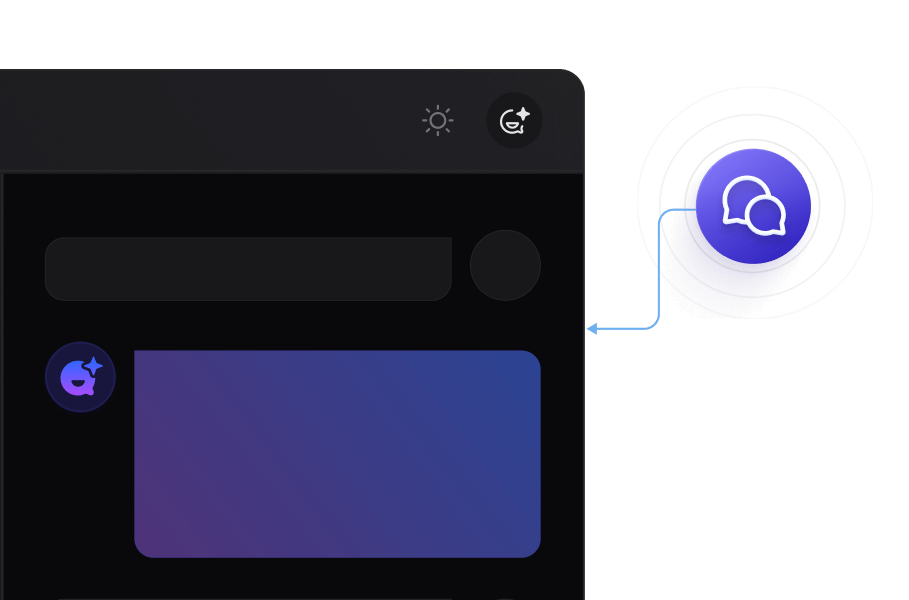


3 reasons to choose Hashnode.
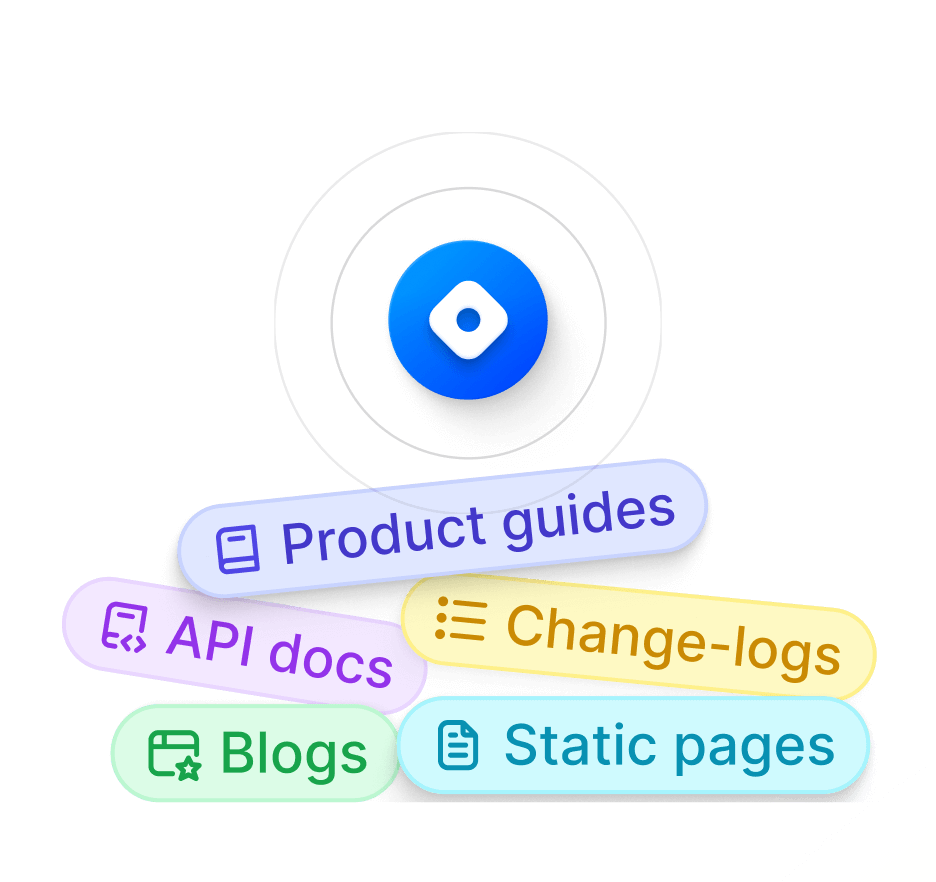
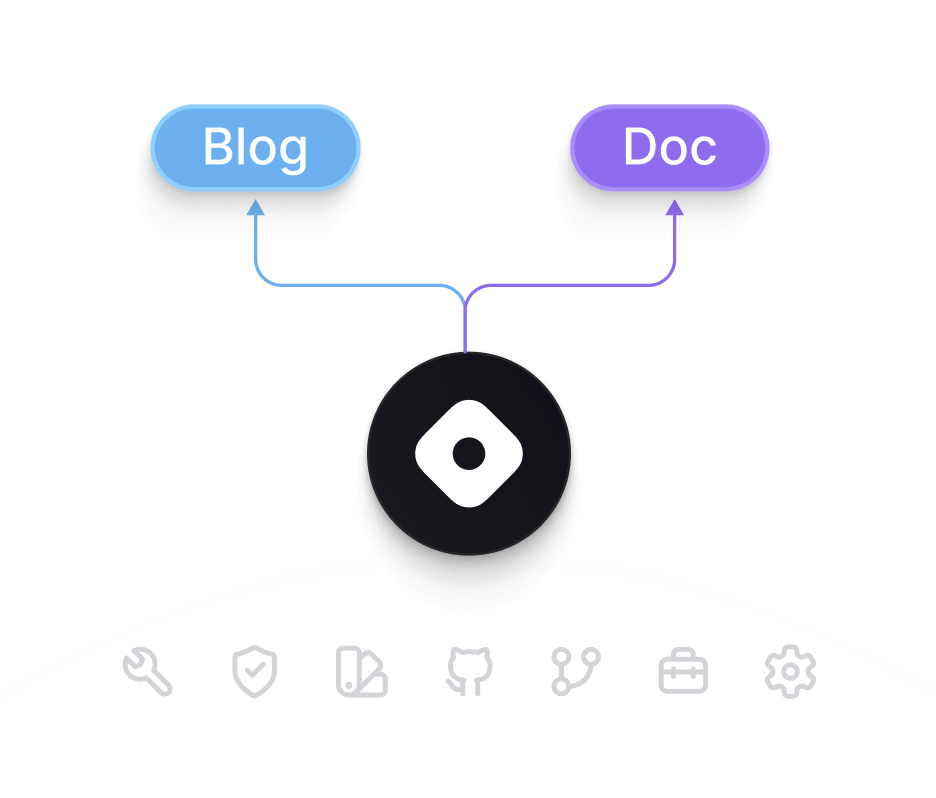
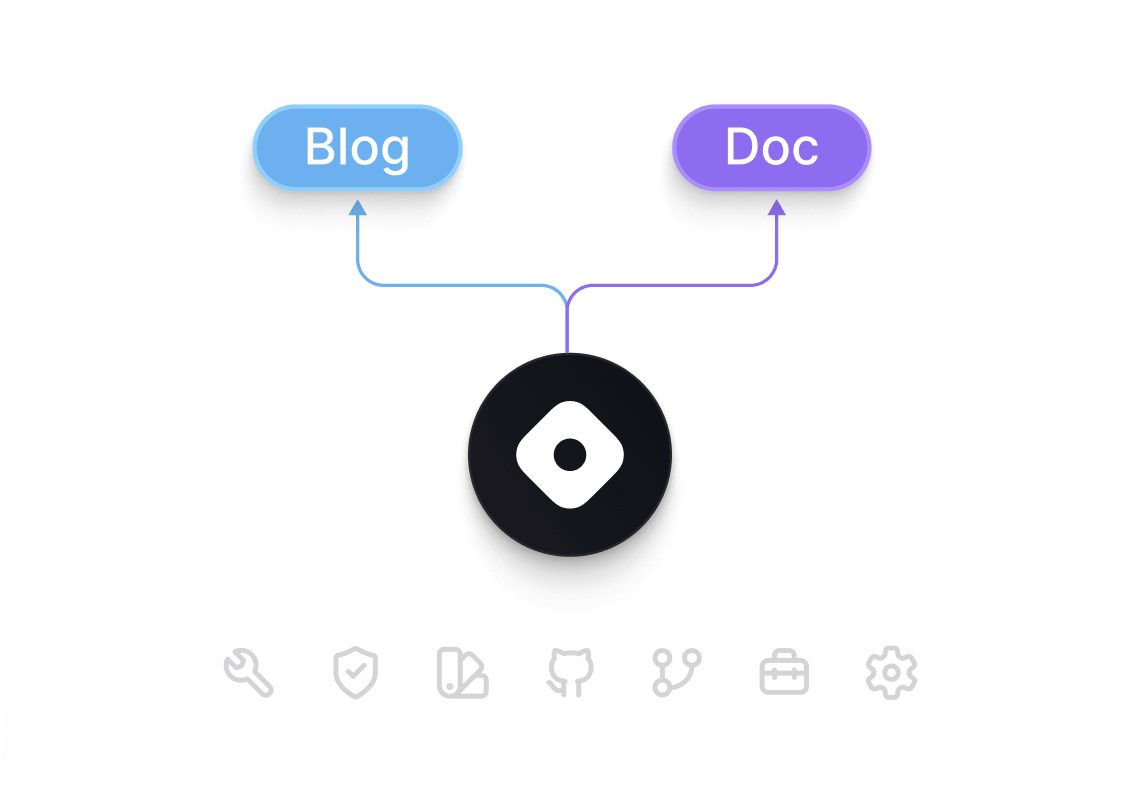
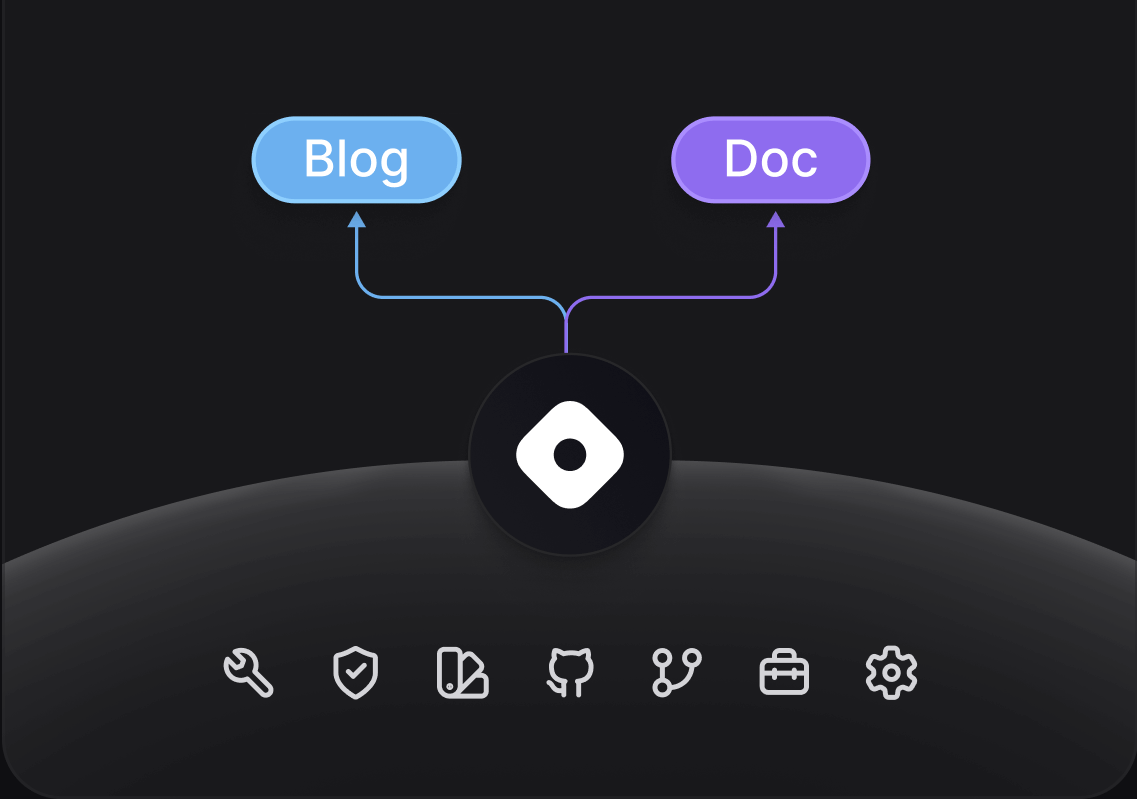
No context switching — One platform for blogs, and docs.
Set up blogs, API docs, or product guides effortlessly on Hashnode, and keep your team on the same page. No more context switching—less to learn, more to get done.
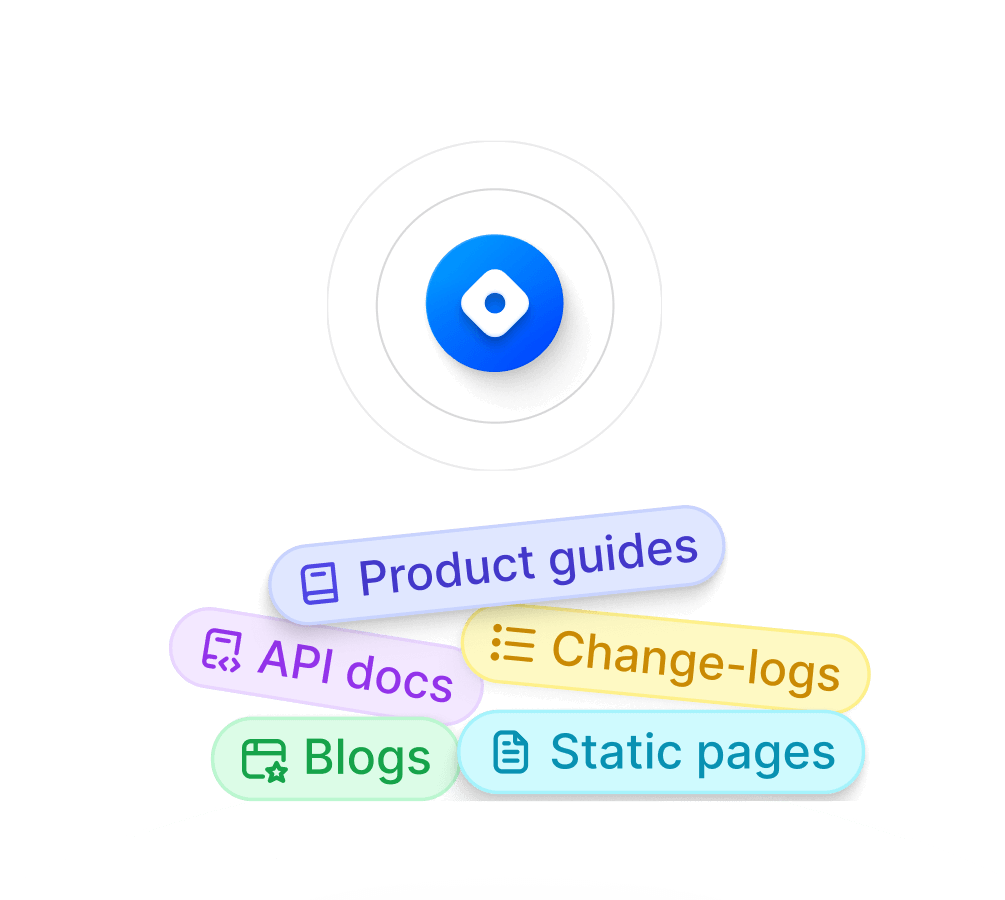

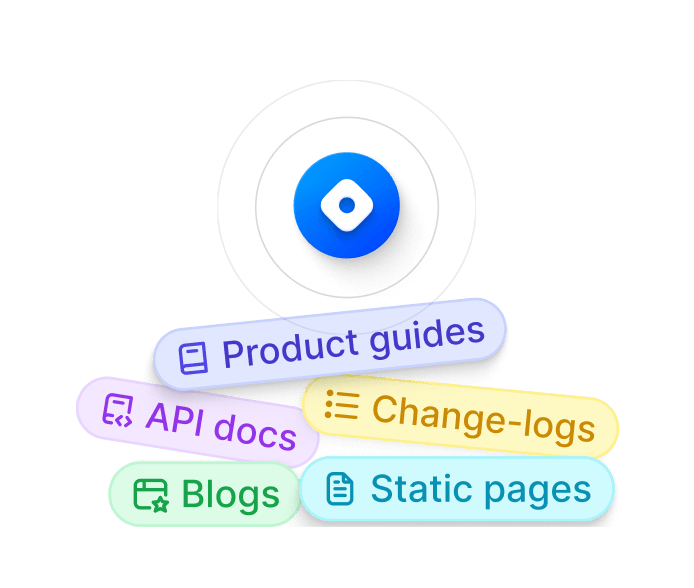

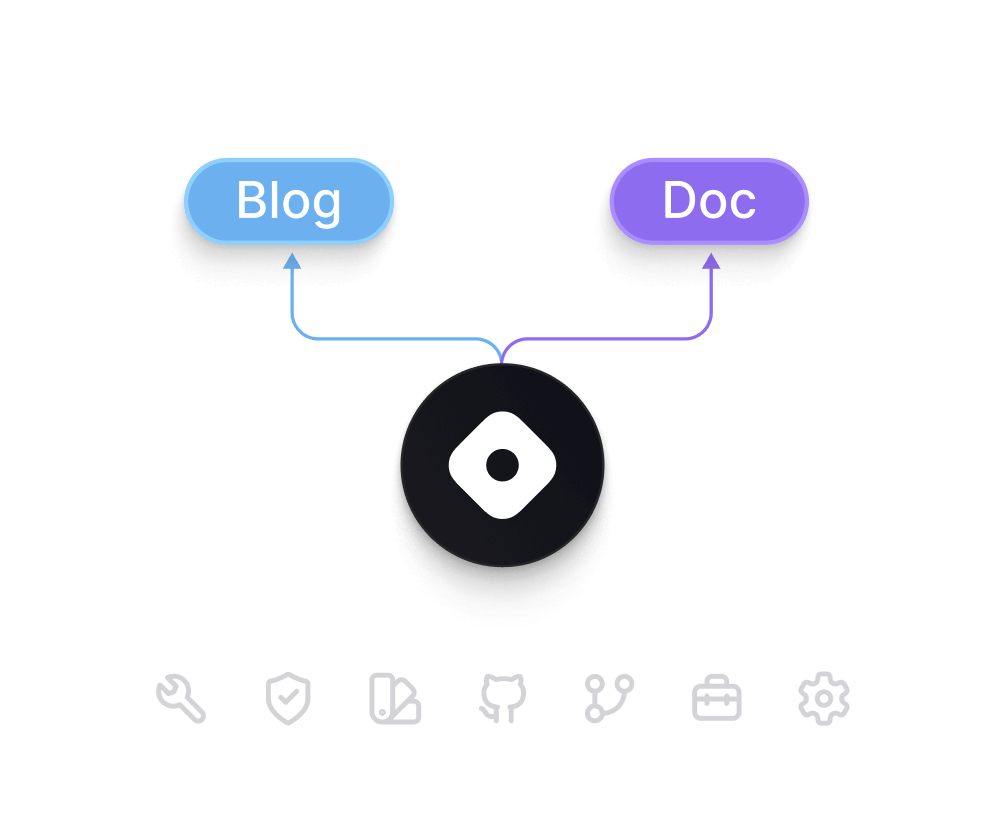
Customize and match your design with headless mode.
Launch a hosted blog or docs, or go fully custom with headless mode—a treat for developers. No need to reinvent the wheel.


Cost-effective with no infrastructure to maintain
Focus on building, not hosting. We handle your blog and docs while your team creates great content—saving you time and costs.




We're the most loved developer platform worldwide.
600,000+
Registered blogs3.5M
Unique reads per month1B+
API calls this year1M
Registered users“It's amazing to see how fast devs go from 0 to Blog under a domain they own on Hashnode 🤯. It reminds me a lot of what Substack did for journalists.”
Guillermo Rauch
CEO, Vercel“Hashnode's writing editor is the best on the internet.””
Costa Tin
Marketing Lead, MindsDB“It took a single developer an afternoon to integrate.”
Kevin Van Gundy
CEO, Hypermode“Hashnode is incredibly easy to integrate into an existing CMS.”
Amy Dutton
Lead Maintainer Core Team, Redwoodjs“Setting up a base blog for our company was super easy.”
Chris Battarbee
CEO, Metoro“Hashnode has made doc creation and collaboration 10x easier than our previous docs which required manual deployments. Their editor is best-in-class, and the UI is beautiful!”
Brandon Strittmatter
Co-Founder & CEO, Outerbase“Hashnode has made doc creation and collaboration 10x easier than our previous docs which required manual deployments. Their editor is best-in-class, and the UI is beautiful!”
Brandon Strittmatter
Co-Founder & CEO, Outerbase“Hashnode's best-in-class docs editor, modern frontend, and fantastic support make managing Requestly's documentation seamless and hassle-free.”
Sahil Gupta
Co-founder, Requestly“Hashnode's best-in-class docs editor, modern frontend, and fantastic support make managing Requestly's documentation seamless and hassle-free.”
Sahil Gupta
Co-founder, Requestly“The freeCodeCamp community makes heavy use of Hashnode's publishing workflow to collaborate on books and tutorials. This has boosted our productivity and saved us a ton of time.”
