It's 2018, and we are still building charts with JavaScript. You might already be using D3.js and Google Charts. But, there are more you may not have heard.
I am going to list out some of the best JavaScript charting libraries that I have recently discovered on GitHub and other places on the web:
Frappe Charts
- Size: 56.1 KB (not gzipped)
- SVG Based
- Responsive
- MIT License
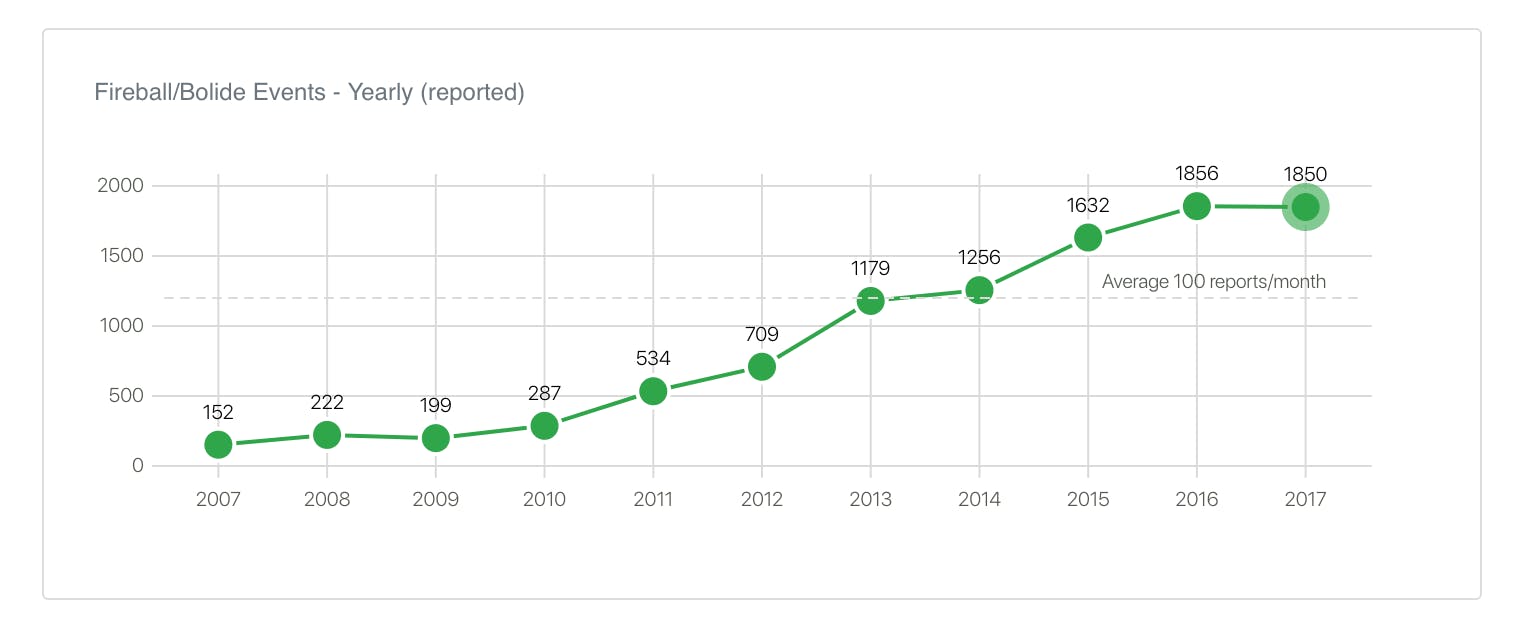
Tip: Check out Month-wise Heatmap demo.
Chartist.js
- Size: 39.3 KB (not gzipped)
- SVG Based
- Responsive
- MIT License
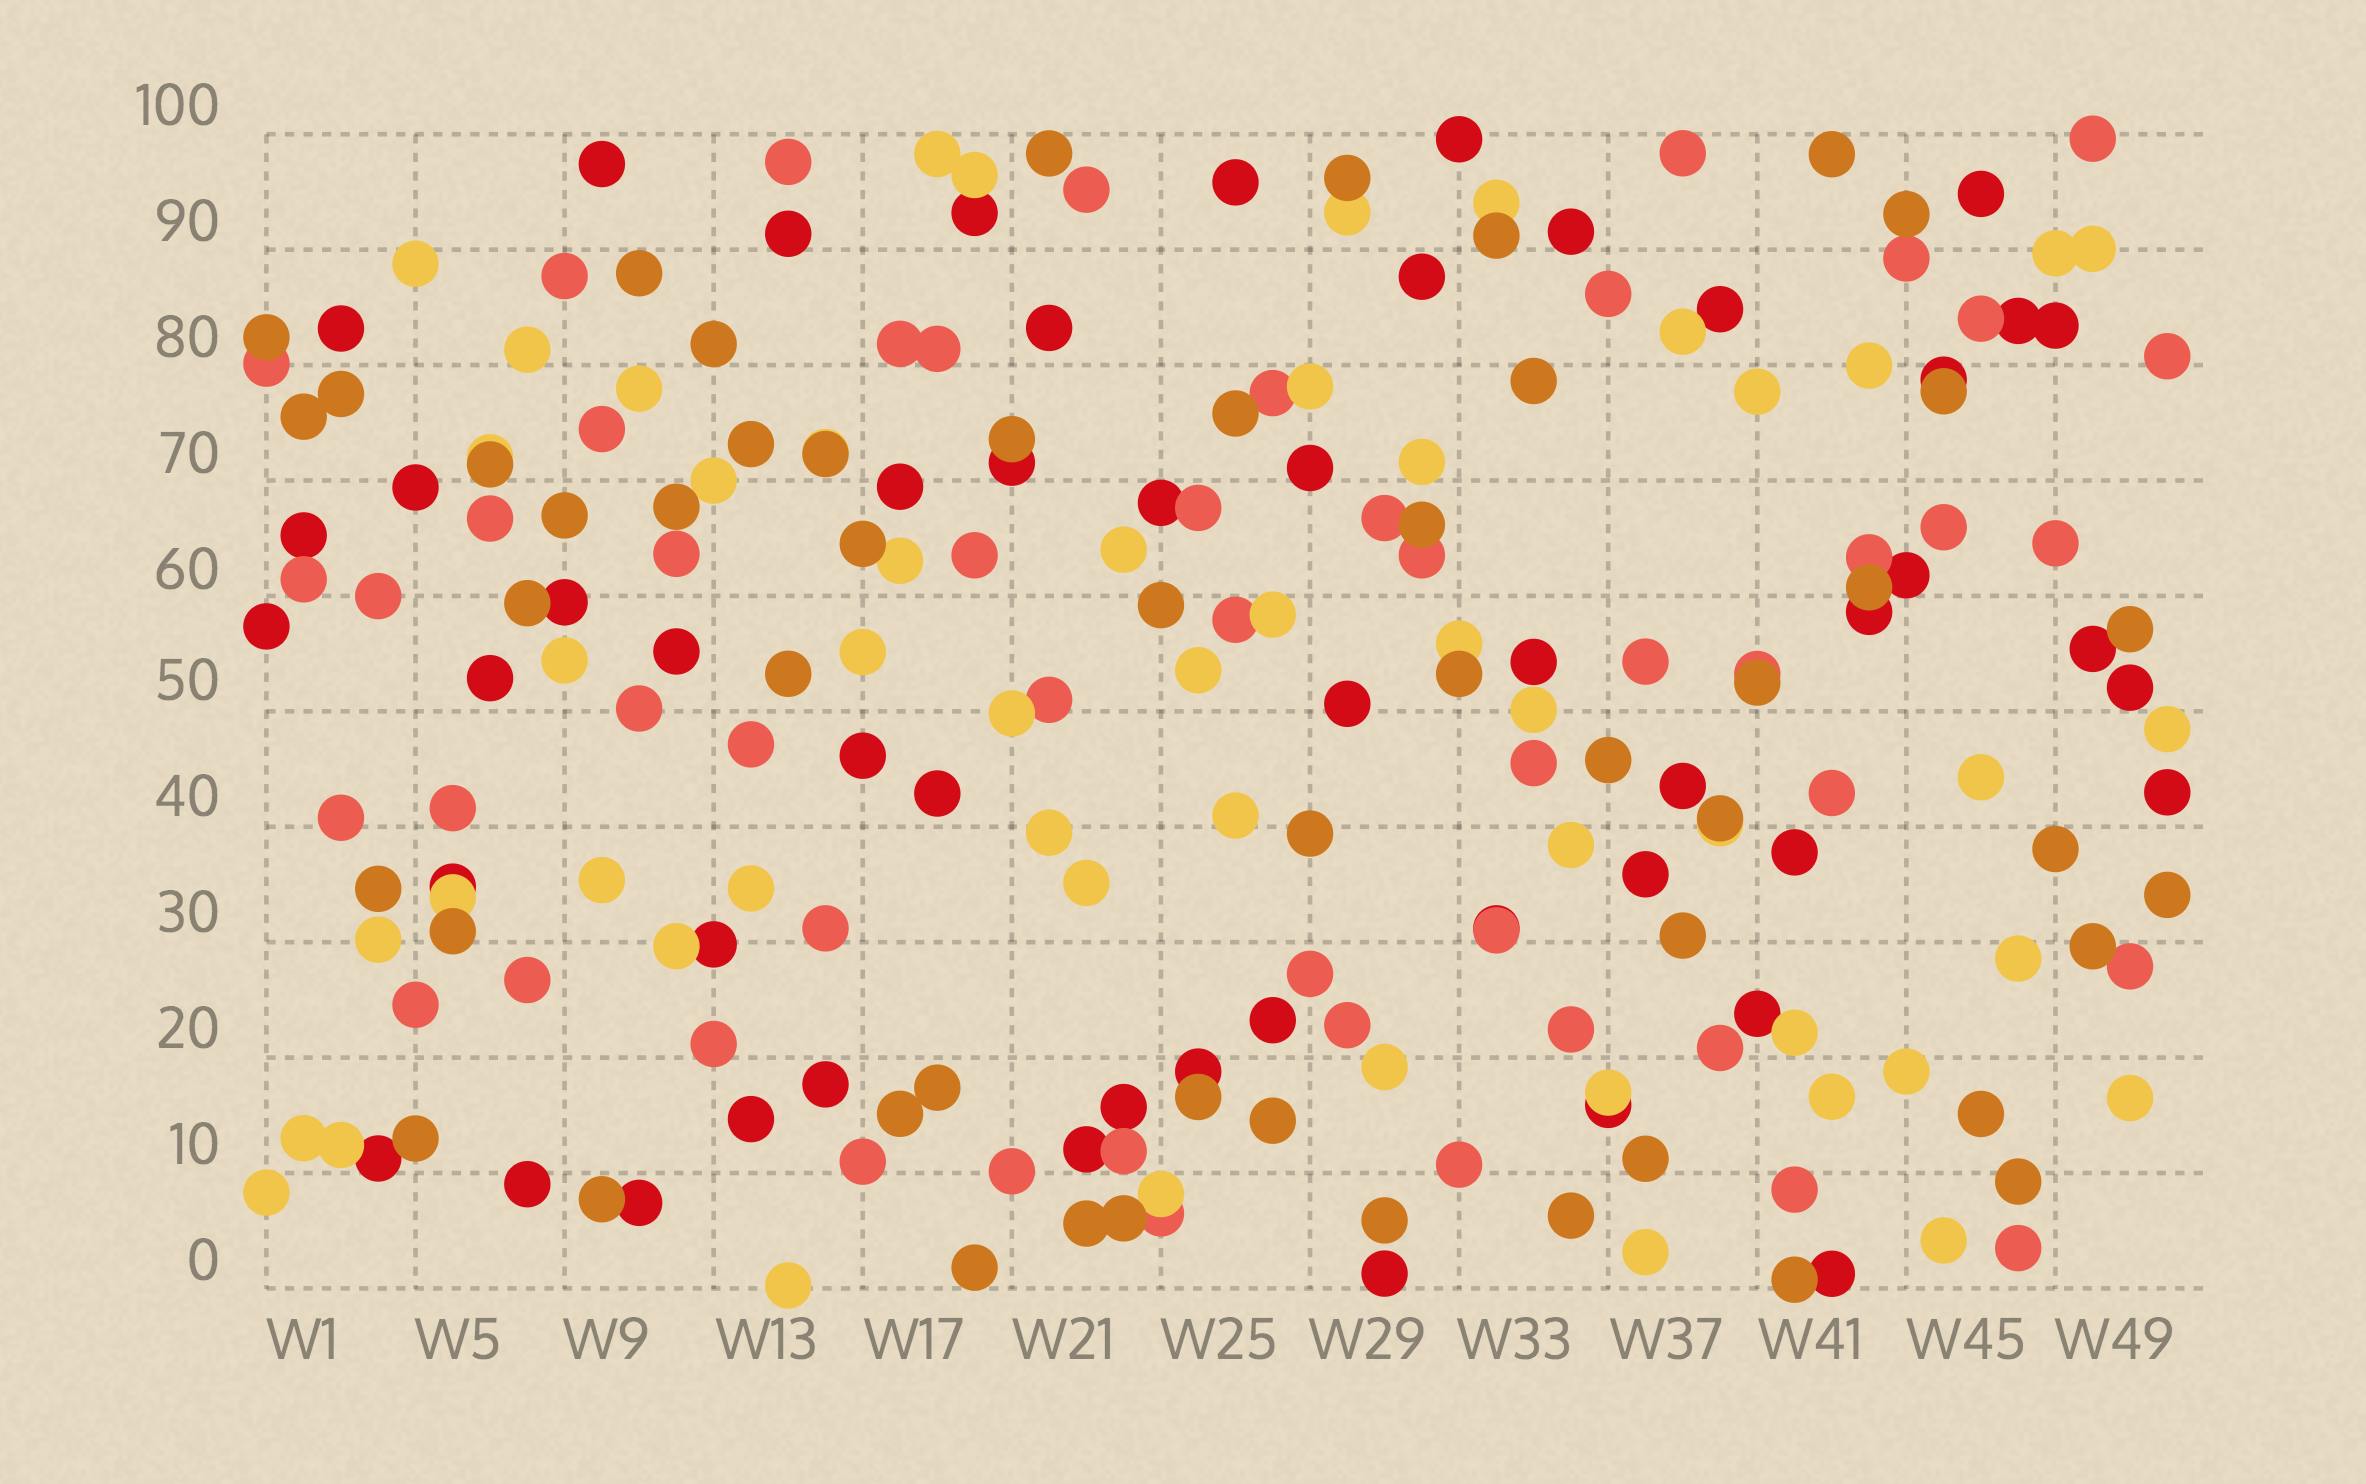
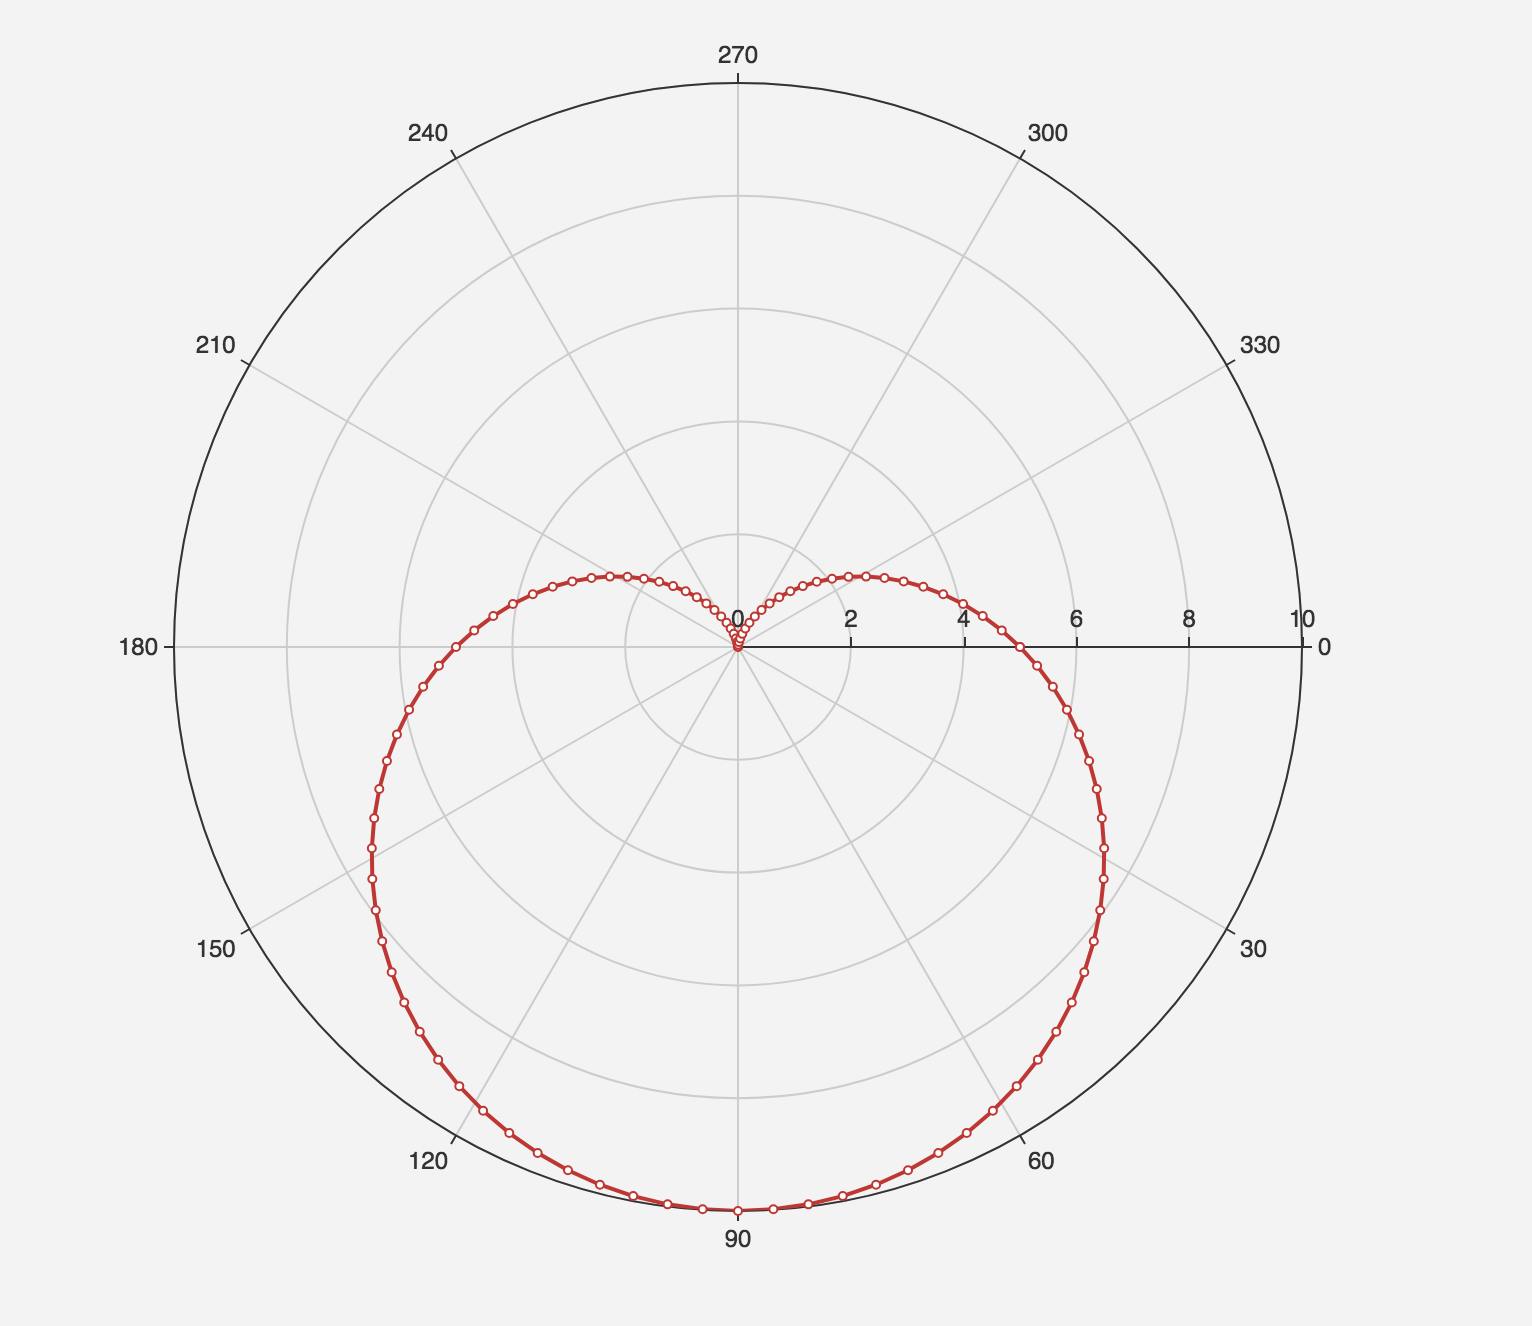
echarts
It's a well-maintained canvas based visualization library.
- Size: 691 KB (not gzipped)
- Canvas Based
- Responsive
- Apache License 2.0
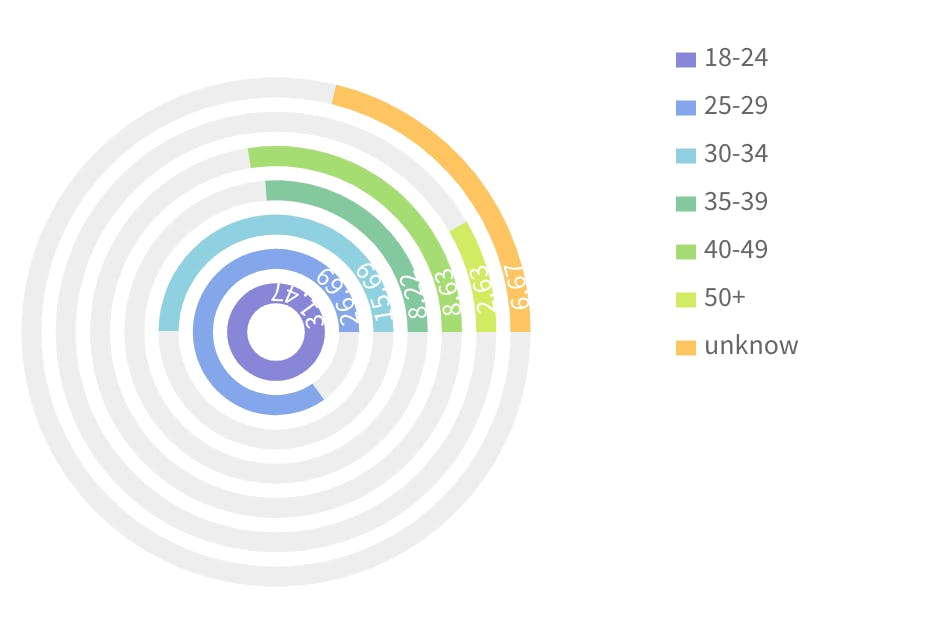
recharts
A composable charting library built on React components
- Size: 508 KB (not gzipped)
- SVG Based
- Not Responsive
- MIT License
c3
D3-based reusable chart library
- Size: 182 KB (not gzipped)
- SVG Based
- Responsive
- MIT License

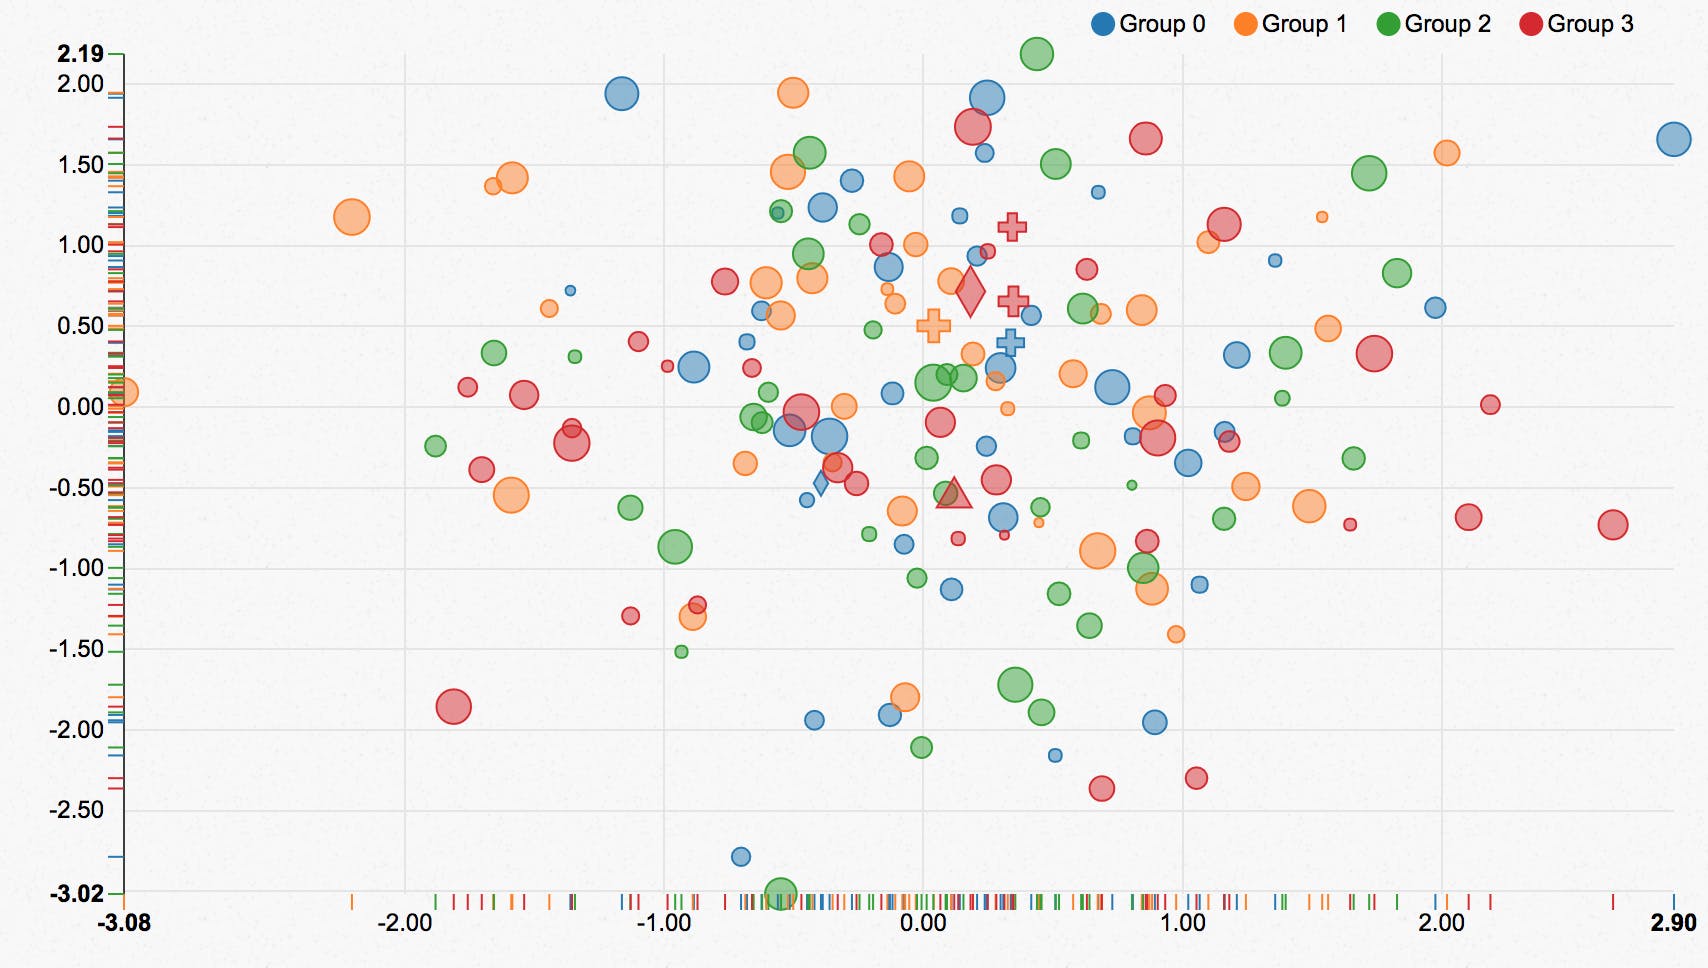
nvd3
A reusable charting library written in d3.js
- Size: 268 KB (not gzipped)
- SVG Based
- Not Responsive
- Custom License
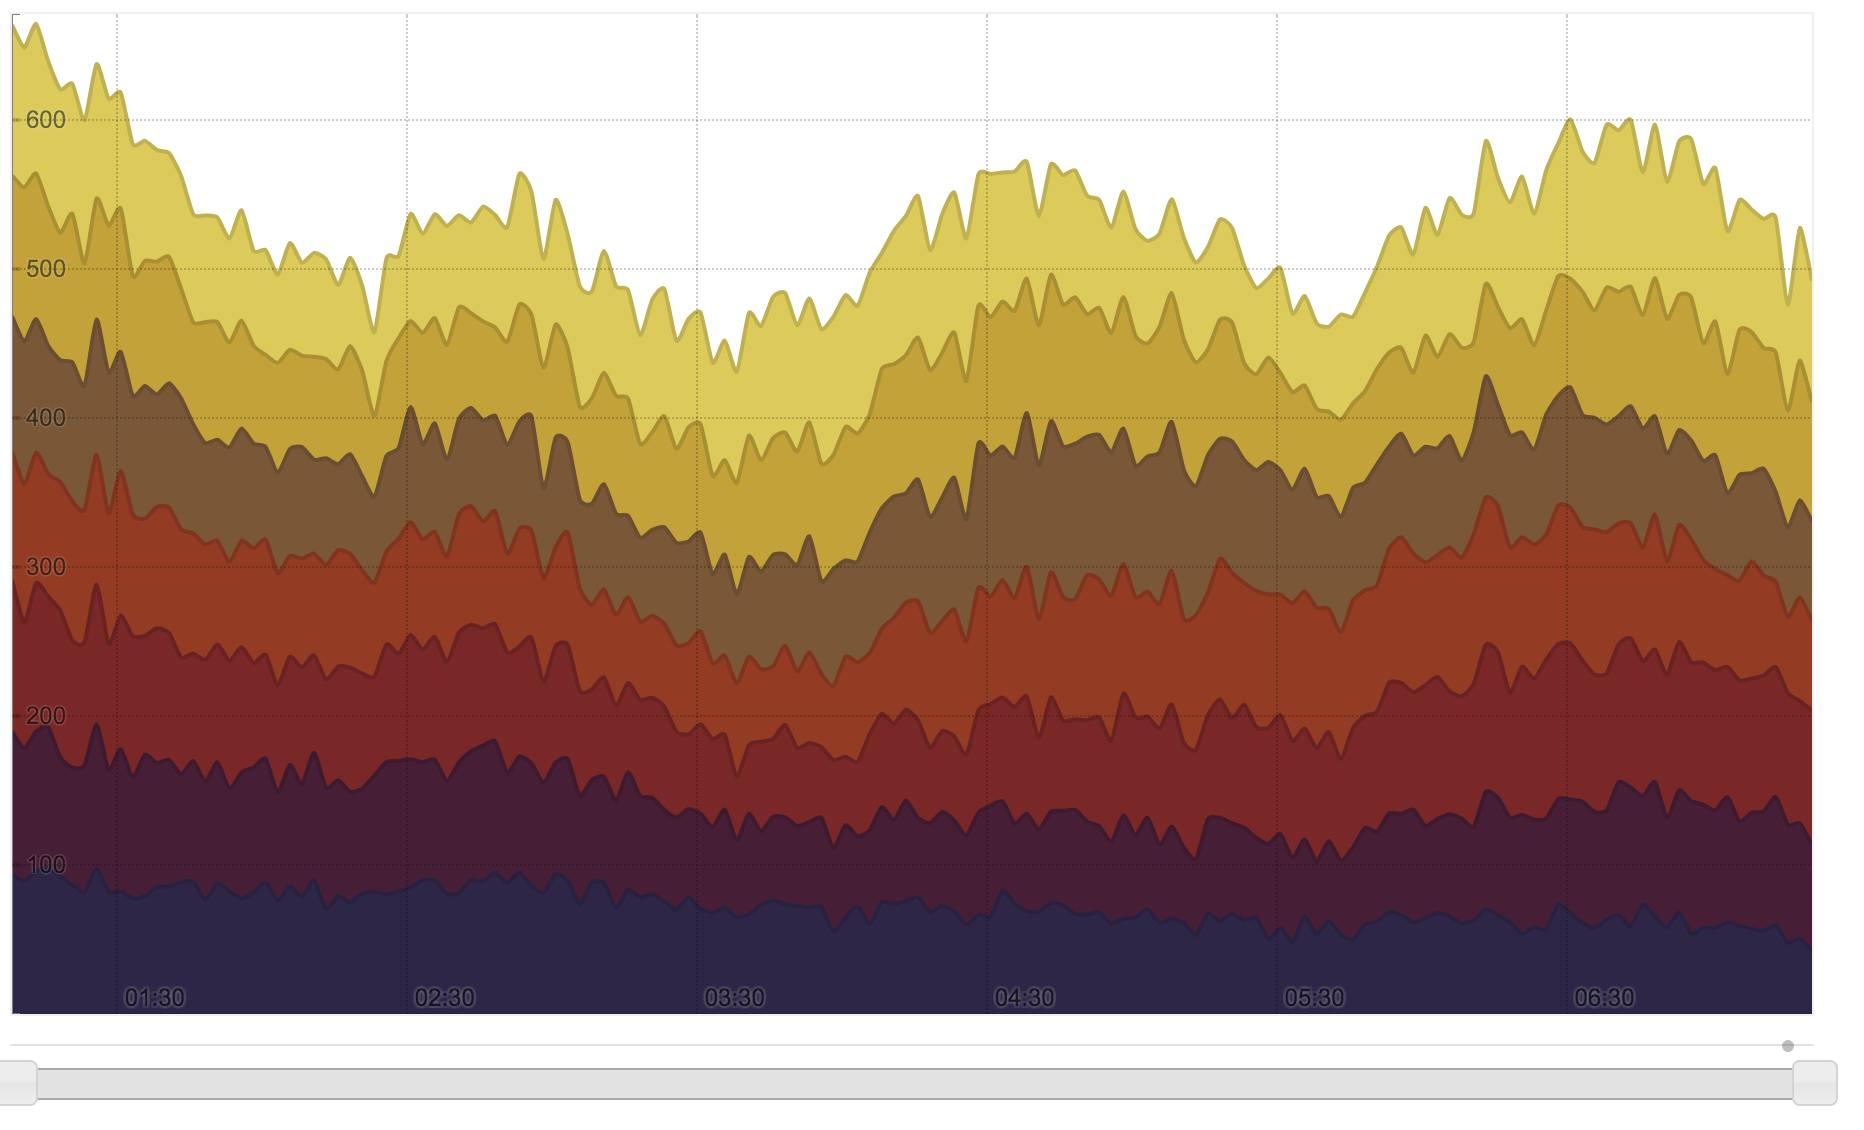
shutterstock/rickshaw
Rickshaw is a JavaScript toolkit built on d3.js for creating interactive time series graphs.
- Size: 78 KB (not gzipped)
- SVG Based
- Responsive
- MIT License
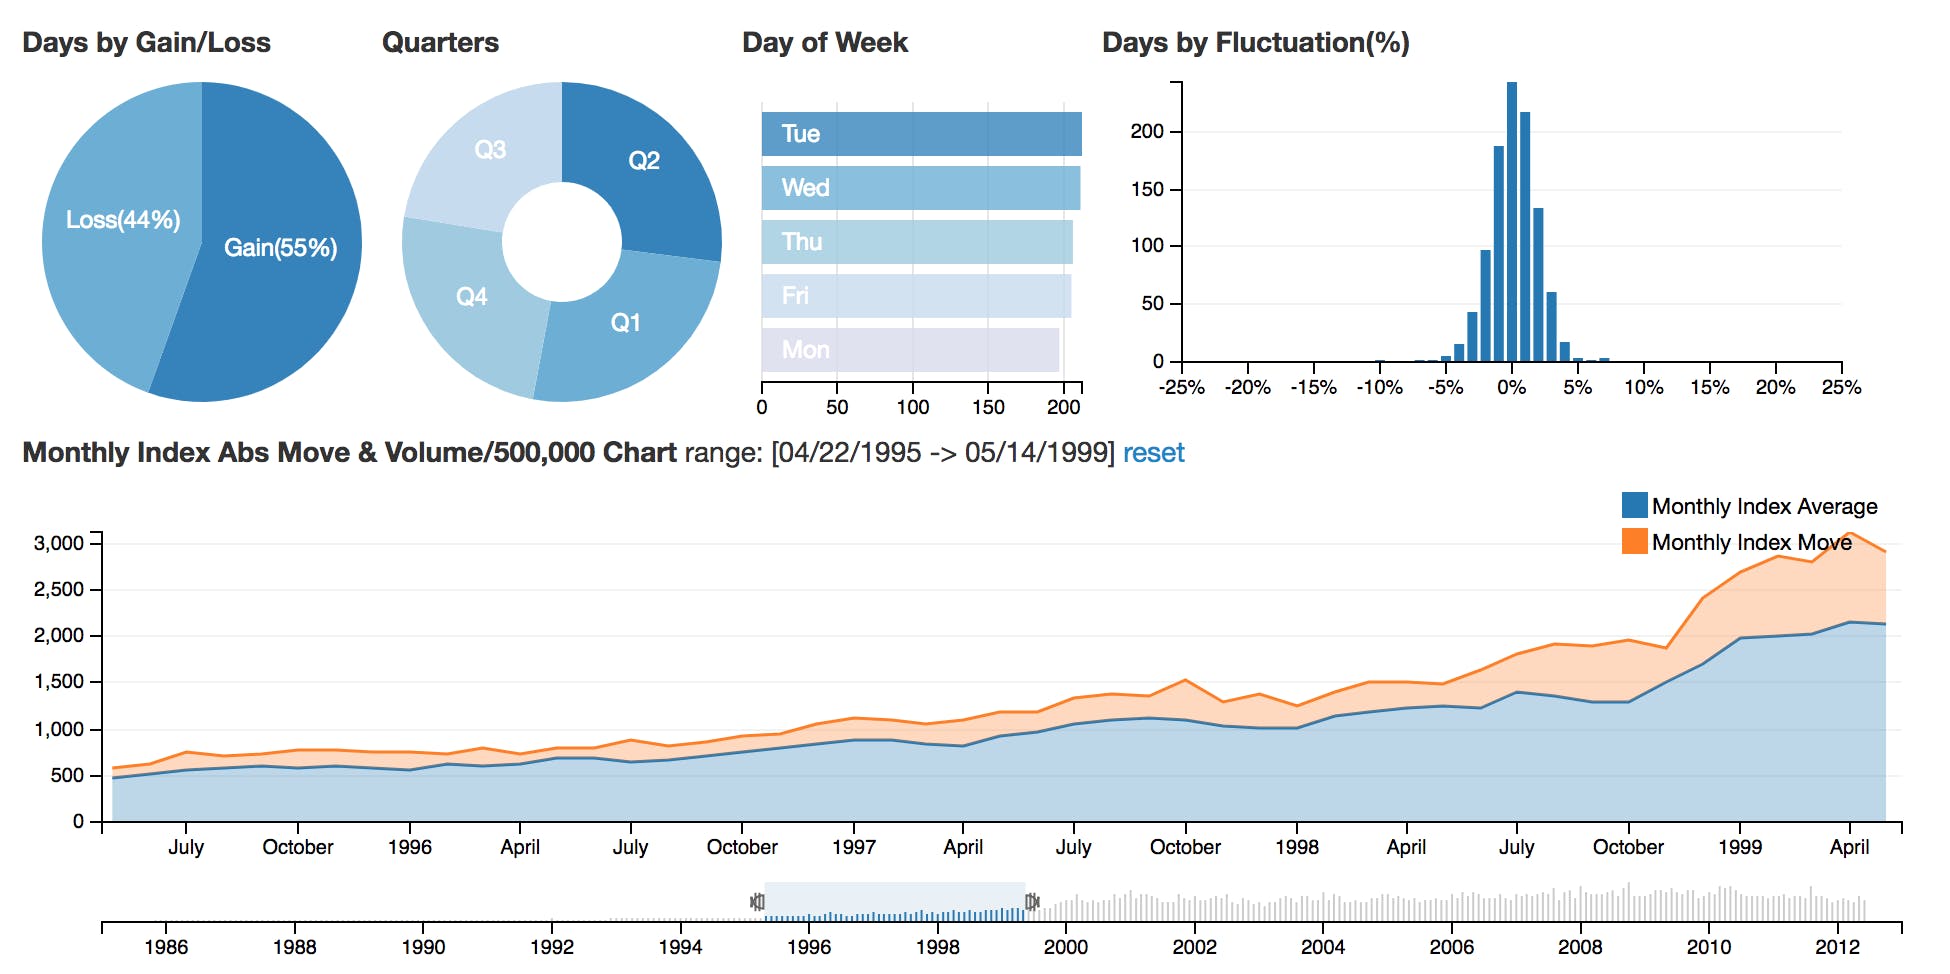
dc.js
D3 based charting library
- Size: 86.7 KB (not gzipped)
- SVG Based
- Not Responsive by default
- Apache License
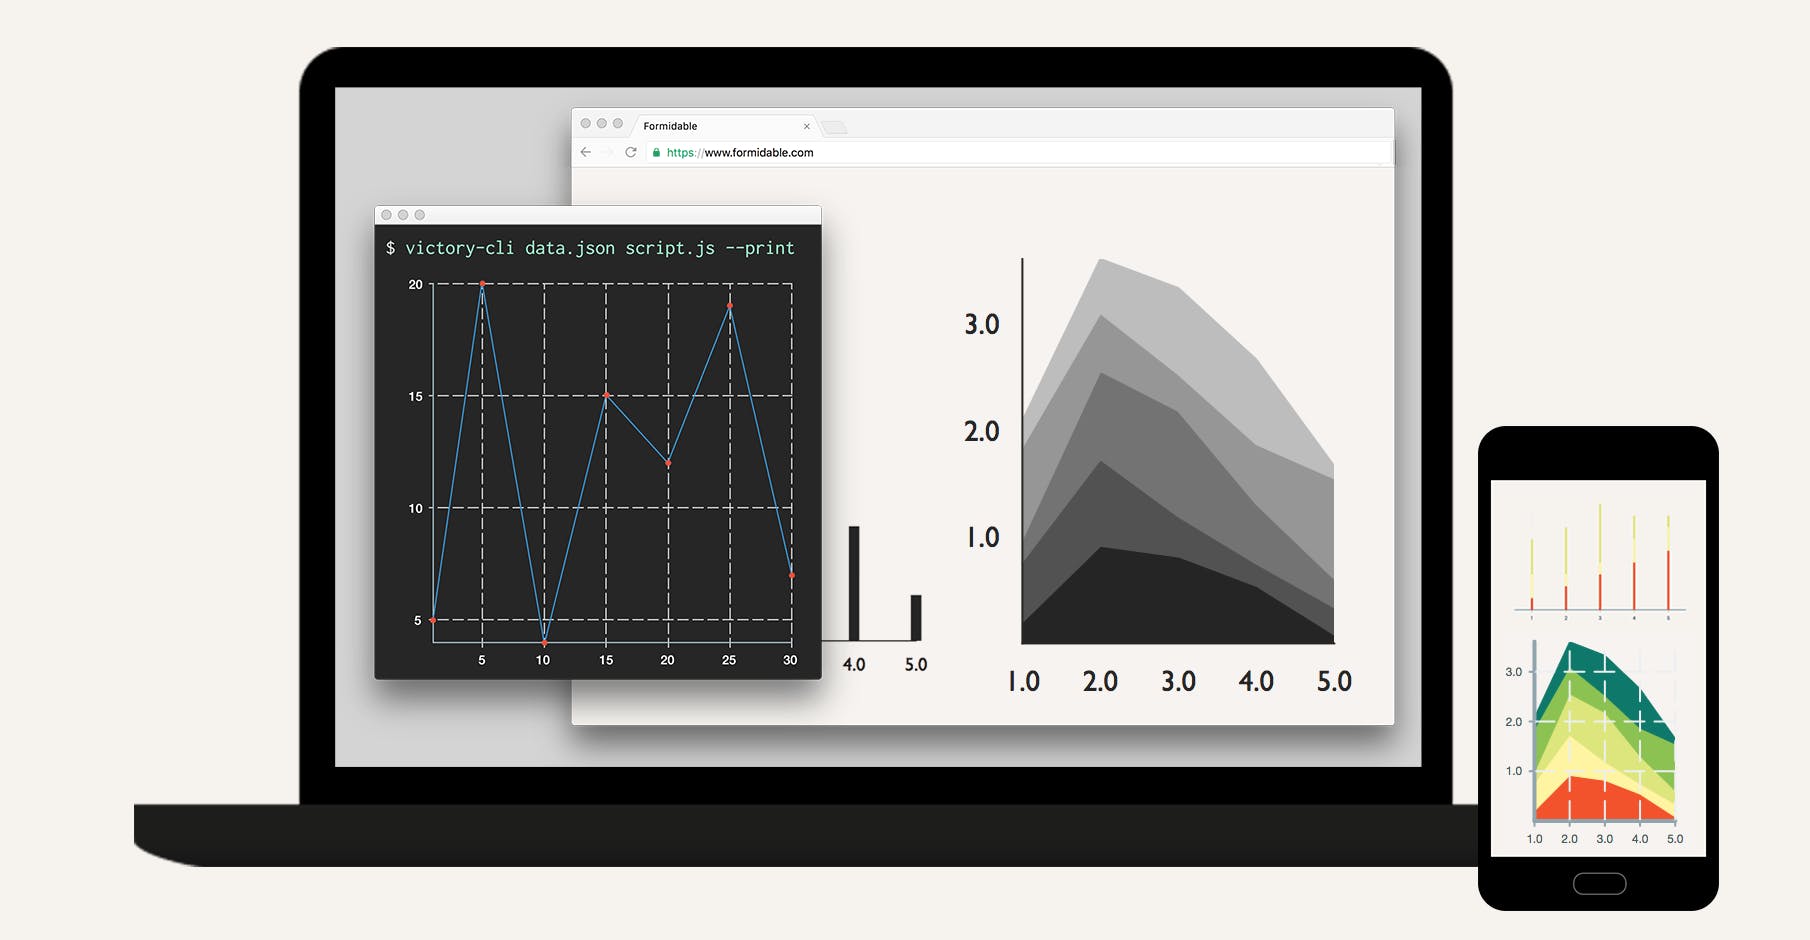
victory
React.js components for modular charting and data visualization.
- Size: 512 KB (not gzipped)
- SVG Based
- Responsive
- MIT License
Feel free to mention any good open source charting library in the comments below. I hope this list is useful to you.
Keep loving Hashnode, the friendly and inclusive dev community. 💝