


I've already covered building a static dashboard with Cube.js and Chart.js in this tutorial. Now, I'm going to show you how to dynamically change the underlying chart's data based on the user's input. We'll let the user pick a date range and based on that, reload the chart. When a user picks a new set of dates, a new request will be sent to the Cube.js server. The Cube.js server will generate new SQL code, execute it against the database, and send the result back to the client. And finally, the client re-renders a chart with the new data.
Here is a Codesandbox demo of what we are going to build. You can click "Open in Editor" to check the source code.
Setting up a Backend
We are going to use our sample e-commerce Postgres dataset. Use the following commands to download it and import it into the ecom database.
$ curl http://cube.dev/downloads/ecom-dump.sql > ecom-dump.sql
$ createdb ecom
$ psql --dbname ecom -f ecom-dump.sql
Next, install Cube.js CLI if you don't have it already and generate a new application.
$ npm install -g cubejs-cli
$ cubejs create chartjs-dynamic-data -d postgres
Cube.js uses environment variables for configuration. To configure the connection to our database, we need to specify the DB type and name. In the Cube.js project folder, replace the contents of the .env file with the following:
CUBEJS_API_SECRET=SECRET
CUBEJS_DB_TYPE=postgres
CUBEJS_DB_NAME=ecom
Now, start the development server and open the localhost:4000 in your browser.
$ npm run dev
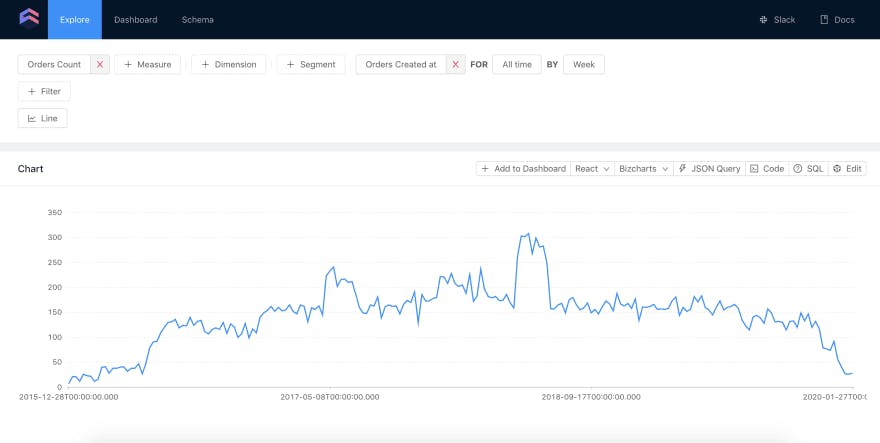
You can generate a schema for the tables in the ecom database under the Schema tab. We're going to use data from only one table—orders. Once you generate this schema, you can play around with the data in the Explore section.
There are multiple ways to deploy Cube.js: Docker, serverless, and Heroku. You can read about all of them here. In this tutorial, we are going to use the Cube.js application deployed to Heroku at https://cubejs-ecom.herokuapp.com/cubejs-api/v1.
Simple Chart
We'll build our frontend on the Codesandox for simplicity. It will load the data from the Cube.js backend deployed on Heroku. You can check out the final source code and the demo app here. Feel free to fork it and play around.
We are using the Vanilla template from Codesanbox and are not going to add any framework, such as React or Vue, to keep things simple. The first step is to include the Cube.js client and Chart.js libraries. Insert the following code inside the <head> tag.
<script src="unpkg.com/@cubejs-client/core@0.10.16/dist…"></script>
<script src="cdnjs.cloudflare.com/ajax/libs/Chart.js/2.…"></script>
To initialize the Cube.js client, you need to pass an API URL along with the Secret.
const cubejsApi = cubejs(
"eyJhbGciOiJIUzI1NiIsInR5cCI6IkpXVCJ9.e30.K9PiJkjegbhnw4Ca5pPlkTmZihoOm42w8bja9Qs2qJg",
  { apiUrl: "cubejs-ecom.herokuapp.com/cubejs-api/v1" }
);
Once the client is initialized, we can request data from the backend and visualize it. The load function accepts a query, which is a plain javascript object, and returns a promise. You can learn more about the query format here.
cubejsApi
    .load({
      measures: ["Orders.count"],
      timeDimensions: [
        {
          dimension: "Orders.createdAt",
          granularity: `day`,
          dateRange: [`08/01/2019`,`09/01/2019`]
        }
      ]
    })
    .then(resultSet => {
      new Chart(document.getElementById("chart"), {
        type: "line",
        options: options,
        data: chartJsData(resultSet)
      });
    });
We are loading Orders.count, which is grouped by the created day to plot as a line chart. To make this code work, we need to make a couple of things. First, add the <canvas> tag to the inside of your html <body>.
<canvas id="chart-canvas"></canvas>
Next, we need to define a chartJsData function, which should accept a resultSet returned from Cube.js and format it for Chart.js.
var chartJsData = function(resultSet) {
  return {
    datasets: [
      {
        label: "Orders Count",
        data: resultSet.chartPivot().map(function(r) {
          return r["Orders.count"];
        }),
        backgroundColor: "rgb(255, 99, 132)"
      }
    ],
    labels: resultSet.categories().map(function(c) {
      return c.x;
    })
  };
};
Lastly, we are declaring some additional Chart.js options for nice axes formatting.
var options = {
  scales: {
    xAxes: [
      {
        type: "time",
        time: {
          displayFormats: {
            hour: "MMM DD"
          },
          tooltipFormat: "MMM D"
        }
      }
    ],
    yAxes: [
      {
        ticks: {
          beginAtZero: true
        }
      }
    ]
  }
};
That is all we need to load a static line chart. Next, we're going to add a date range picker and load data dynamically based on the date range selected by the user.
Dynamic Data
Add Jquery, Date Range Picker, and Moment.js libraries to your <head> tag.
<script src="cdn.jsdelivr.net/jquery/latest/jquery.min.js"></script>
<script src="cdn.jsdelivr.net/momentjs/latest/moment.mi…"></script>
<script src="cdn.jsdelivr.net/npm/daterangepicker/dater…"></script>
<link rel="stylesheet" href="cdn.jsdelivr.net/npm/daterangepicker/dater…"/>
Next, let's wrap the code to render a chart into the drawChart function, which is going to accept two arguments: start date and end date.
var drawChart = function(startDate, endDate) {
  cubejsApi
    .load({
      measures: ["Orders.count"],
      timeDimensions: [
        {
          dimension: "Orders.createdAt",
          granularity: `day`,
          dateRange: [startDate, endDate]
        }
      ]
    })
    .then(resultSet => {
      if (window.chart) {
        window.chart.data = data;
        window.chart.update();
      } else {
        window.chart = new Chart(document.getElementById("chart-canvas"),
        {
          type: "line",
          options: options,
          data: data
        });
      }
    });
};
Besides making the dateRange dynamic, we're also saving the current chart into windows.chart so we can update it later when we need to re-render the chart.
Finally, we can add an input to our html body and make it a date range picker:
<input name="dates" />
const START_DATE = "08/01/2019";
const END_DATE = "09/01/2019";

$('input[name="dates"]').daterangepicker(
  {
    startDate: START_DATE,
    endDate: END_DATE
  },
  function(start, end) {
    drawChart(start, end);
  }
);
drawChart(START_DATE, END_DATE);
That is it! Now we have a fully working dynamic and interactive chart. You can select different dates from the date picker and see how the chart is changing.
If you have any questions about this tutorial or about Cube.js in general—feel free to ping me in the Slack Cube.js Community.