This article was originally written by Jakub Czakon and posted on the Neptune blog.
Working with PyTorch Lightning and wondering which logger should you choose to keep track of your experiments?
Thinking of using PyTorch Lightning to structure your Deep Learning code and wouldn't mind learning about it's logging functionality?
Didn't know that Lightning has a pretty awesome Neptune integration?
This article is (very likely) for you.
Why PyTorch Lightning and Neptune?
If you never heard of it, PyTorch Lightning is a very lightweight wrapper on top of PyTorch which is more like a coding standard than a framework. The format allows you to get rid of a ton of boilerplate code while keeping it easy to follow.
The result is a framework that gives researchers, students, and production teams the ultimate flexibility to try crazy ideas without having to learn yet another framework while automating away all the engineering details.
Some great features that you can get out-of-the-box are:
- Train on CPU, GPU or TPUs without changing your code,
- Trivial multi-GPU and multi-node training,
- Trivial 16 bit precision support,
- Built-in performance profiler (Trainer(profile=True)).
and a ton of other great functionalities.
But with this great power of running experiments easily and flexibility in tweaking anything you want comes a problem.
How to keep track of all the changes like:
- losses and metrics,
- hyperparameters,
- model binaries,
- validation predictions.
and other things that will help you organize your experimentation process?
Fortunately, PyTorch lightning gives you an option to easily connect loggers to the pl.Trainer and one of the supported loggers that can track all of the things mentioned before (and many others) is the NeptuneLogger which saves your experiments in… you guessed it Neptune.
Neptune not only tracks your experiment artifacts but also:
- let's you monitor everything live,
- gives you a nice UI where you can filter, group and compare various experiment runs
- access experiment data that you logged programmatically from a Python script or Jupyter Notebook
The best part is that this integration really is trivial to use.
Let me show you how it looks.
Note: You can also check out this colab notebook and play with the examples we will talk about yourself.
Basic Integration
In the simplest case you just create the NeptuneLogger:
from pytorch_lightning.logging.neptune import NeptuneLogger
neptune_logger = NeptuneLogger(
    api_key="ANONYMOUS",
    project_name="shared/pytorch-lightning-integration")
and pass it to the logger argument of Trainer and fit your model.
from pytorch_lightning import Trainer
trainer = Trainer(logger=neptune_logger)
trainer.fit(model)
By doing so you get your:
- Metrics and losses logged and charts created,
- Hyperparameters saved (if defined via lightning hparams),
- Hardware utilization logged,
- Git info and execution script logged.
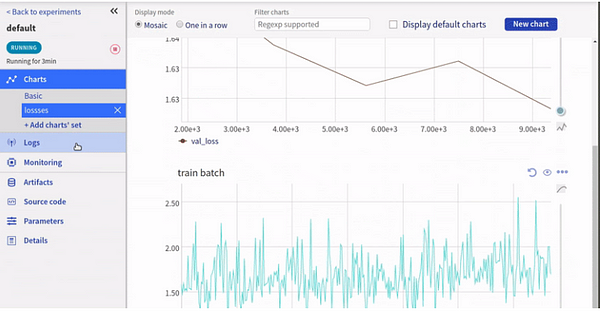
Check out this experiment.
 You can monitor your experiments, compare them, and share them with others.
Not too bad for a 4-liner.
But with just a bit more effort you can get a lot more.
Advanced Options
Neptune gives you a lot of customization options and you can simply log more experiment-specific things, like image predictions, model weights, performance charts and more.
All of that functionality is available for Lightning users and in the next sections I will show you how to leverage Neptune to the fullest.
Logging extra information at NeptuneLogger creation
When you are creating the logger you can log additional useful information:
- code: snapshot scripts, jupyter notebooks, config files, and more
- hyperparameters: log learning rate, number of epochs and other things (if you are using lightning
hparamsobject from lightning it will be logged automatically) - properties: log data locations, data versions, or other things
- tags: add tags like "resnet50" or "no-augmentation" to organize your runs.
- name: every experiment deserves a meaningful name so let's not use "default" every time 🙂 shall we
Just pass this information to your logger:
neptune_logger = NeptuneLogger(
    api_key="ANONYMOUS",
    project_name="shared/pytorch-lightning-integration",
    experiment_name="default",  # Optional,
    params={"max_epochs": 10,
            "batch_size": 32},  # Optional,
    tags=["pytorch-lightning", "mlp"]  # Optional,
    upload_source_files=["**/*.py", "*.yaml"]  # Optional,
)
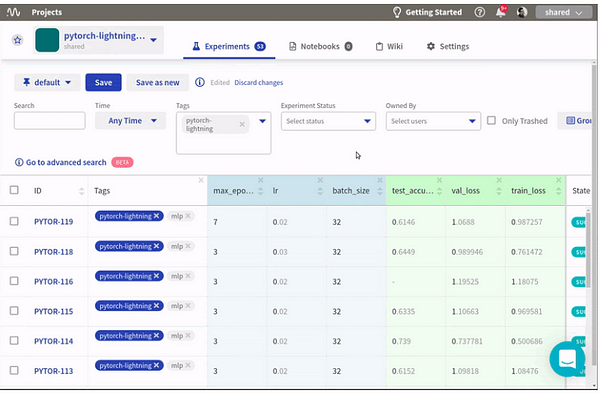
… and proceed as before to get an organized dashboard like this one.
Logging extra things during training
A lot of interesting information can be logged during training.
You may be interested in monitoring things like:
- model predictions after each epochs (think prediction masks or overlaid bounding boxes)
- diagnostic charts like ROC AUC curve or Confusion Matrix
- model checkpoints, or other objects
It is really simple. Just go to your LightningModule and call methods of the Neptune experiment available as self.logger.experiment.
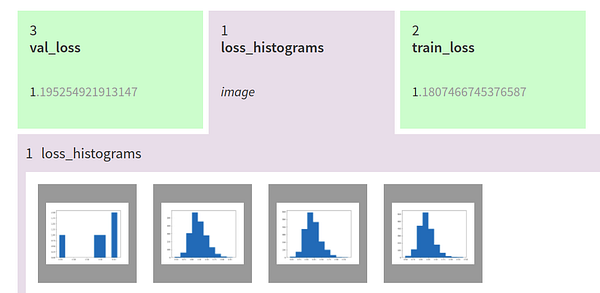
For example, we can log histograms of losses after each epoch:
class CoolSystem(pl.LightningModule):

    def validation_end(self, outputs):
        # OPTIONAL
        avg_loss = torch.stack([x['val_loss'] for x in outputs]).mean()
        tensorboard_logs = {'val_loss': avg_loss}

        # log debugging images like histogram of losses
        fig = plt.figure()
        losses = np.stack([x['val_loss'].numpy() for x in outputs])
        plt.hist(losses)
        self.logger.experiment.log_image('loss_histograms', fig)
    plt.close(fig)

        return {'avg_val_loss': avg_loss, 'log': tensorboard_logs}

self.logger.experiment.log_metric# log custom metricsself.logger.experiment.log_text# log text valuesself.ogger.experiment.log_artifact# log filesself.logger.experiment.log_image# log images, chartsself.logger.experiment.set_property# add key:value pairsself.logger.experiment.append_tag# add tags for organization
Pretty cool right?
But … that is not all you can do!
Logging things after training has finished
Tracking your experiment doesn't have to finish after your .fit loop ends.
You may want to track the metrics of the trainer.test(model) or calculate some additional validation metrics and log them.
To do that you just need to tell NeptuneLogger not to close after fit:
neptune_logger = NeptuneLogger(
    api_key="ANONYMOUS",
    project_name="shared/pytorch-lightning-integration",
    close_after_fit=False,
    ...
)
… and you can keep logging 🙂
Test metrics:
trainer.test(model)
Additional (external) metrics:
from sklearn.metrics import accuracy_score
...
accuracy = accuracy_score(y_true, y_pred)
neptune_logger.experiment.log_metric('test_accuracy', accuracy)
Performance charts on test set:
from scikitplot.metrics import plot_confusion_matrix
import matplotlib.pyplot as plt
...
fig, ax = plt.subplots(figsize=(16, 12))
plot_confusion_matrix(y_true, y_pred, ax=ax)
neptune_logger.experiment.log_image('confusion_matrix', fig)
The whole model checkpoints directory:
neptune_logger.experiment.log_artifact('my/checkpoints')
Go to this experiment to see how those objects are logged:

But … there is even more!
Neptune lets you fetch experiments after training.
Let me show you how.
Fetching your experiment information directly to the notebooks
You can fetch experiments after they have finished, analyze the results and update metrics, artifacts or other things if you want to.
import neptune

project = neptune.init('shared/pytorch-lightning-integration')
project.get_leaderboard().head()
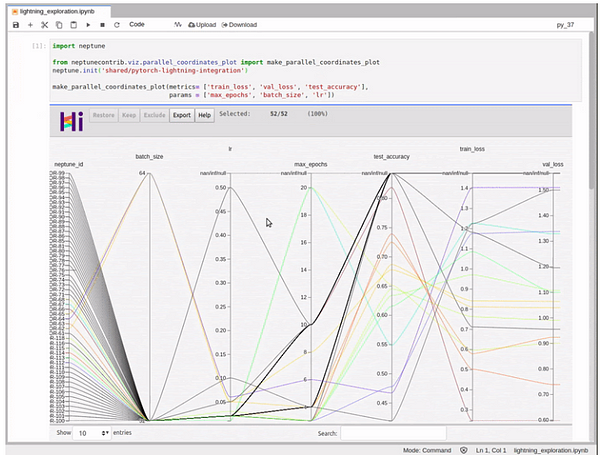
For example, let's fetch the experiments dashboard to a pandas DataFrame: or visualize it with HiPlot via neptune HiPlot integration:
from neptunecontrib.viz import make_parallel_coordinates_plot

make_parallel_coordinates_plot(
           metrics= ['train_loss', 'val_loss', 'test_accuracy'],
           params = ['max_epochs', 'batch_size', 'lr'])

or fetch a single experiment and update it with some external metric calculated after training:
exp = project.get_experiments(id='PYTOR-63')[0]
exp.log_metric('some_external_metric', 0.92)
As you can see there are a lot of things you can log to Neptune from Pytorch Lightning. If you want to go deeper into this:
- read the integration docs
- go check out Neptune to see other things it can do,
- try out Lightning + Neptune on colab
Final Thought
Pytorch Lightning is a great library that helps you with:
- organizing your deep learning code to make it easily understandable to other people,
- outsourcing development boilerplate to a team of seasoned engineers,
- accessing a lot of state-of-the-art functionalities with almost no changes to your code
With Neptune integration, you get some additional things for free:
- you can monitor and keep track of your deep learning experiments
- you can share your research with other people easily
- you and your team can access experiment metadata and collaborate more efficiently.
Hopefully, with all that power you will know exactly what you (and other people) tried and your deep learning research will be moving at a lightning speed 🙂
Bonus: full PyTorch Lightning tracking script
pip install --upgrade torch pytorch-lightning \
    neptune-client neptune-contrib[viz] \
    matplotlib scikit-plot
import os

import torch
from torch.nn import functional as F
from torch.utils.data import DataLoader
from torchvision.datasets import MNIST
from torchvision import transforms

import pytorch_lightning as pl

MAX_EPOCHS=7
LR=0.02
BATCHSIZE=32
CHECKPOINTS_DIR = 'my_models/checkpoints'

class CoolSystem(pl.LightningModule):

    def __init__(self):
        super(CoolSystem, self).__init__()
        # not the best model...
        self.l1 = torch.nn.Linear(28 * 28, 10)

    def forward(self, x):
        return torch.relu(self.l1(x.view(x.size(0), -1)))

    def training_step(self, batch, batch_idx):
        # REQUIRED
        x, y = batch
        y_hat = self.forward(x)
        loss = F.cross_entropy(y_hat, y)
        tensorboard_logs = {'train_loss': loss}
        return {'loss': loss, 'log': tensorboard_logs}

    def validation_step(self, batch, batch_idx):
        # OPTIONAL
        x, y = batch
        y_hat = self.forward(x)
        return {'val_loss': F.cross_entropy(y_hat, y)}

    def validation_end(self, outputs):
        # OPTIONAL
        avg_loss = torch.stack([x['val_loss'] for x in outputs]).mean()
        tensorboard_logs = {'val_loss': avg_loss}

        fig = plt.figure()
        losses = np.stack([x['val_loss'].numpy() for x in outputs])
        plt.hist(losses)
        self.logger.experiment.log_image('loss_histograms', fig)

        return {'avg_val_loss': avg_loss, 'log': tensorboard_logs}

    def test_step(self, batch, batch_idx):
        # OPTIONAL
        x, y = batch
        y_hat = self.forward(x)
        return {'test_loss': F.cross_entropy(y_hat, y)}

    def test_end(self, outputs):
        # OPTIONAL
        avg_loss = torch.stack([x['test_loss'] for x in outputs]).mean()
        tensorboard_logs = {'test_loss': avg_loss}
        return {'avg_test_loss': avg_loss, 'log': tensorboard_logs}

    def configure_optimizers(self):
        # REQUIRED
        # can return multiple optimizers and learning_rate schedulers
        # (LBFGS it is automatically supported, no need for closure function)
        return torch.optim.Adam(self.parameters(), lr=LR)

    @pl.data_loader
    def train_dataloader(self):
        # REQUIRED
        return DataLoader(MNIST(os.getcwd(), train=True, download=True, transform=transforms.ToTensor()), batch_size=BATCHSIZE)

    @pl.data_loader
    def val_dataloader(self):
        # OPTIONAL
        return DataLoader(MNIST(os.getcwd(), train=True, download=True, transform=transforms.ToTensor()), batch_size=BATCHSIZE)

    @pl.data_loader
    def test_dataloader(self):
        # OPTIONAL
        return DataLoader(MNIST(os.getcwd(), train=False, download=True, transform=transforms.ToTensor()), batch_size=BATCHSIZE)


from pytorch_lightning.loggers.neptune import NeptuneLogger

neptune_logger = NeptuneLogger(
    api_key="ANONYMOUS",
    project_name="shared/pytorch-lightning-integration",
    close_after_fit=False,
    experiment_name="default",  # Optional,
    params={"max_epochs": MAX_EPOCHS,
            "batch_size": BATCHSIZE,
            "lr": LR}, # Optional,
    tags=["pytorch-lightning", "mlp"],
    upload_source_files=['*.py','*.yaml'],
    upload_stderr=False,
    upload_stdout=False
)
model_checkpoint = pl.callbacks.ModelCheckpoint(filepath=CHECKPOINTS_DIR)

from pytorch_lightning import Trainer

model = CoolSystem()
trainer = Trainer(max_epochs=MAX_EPOCHS,
                  logger=neptune_logger,
                  checkpoint_callback=model_checkpoint,
                  )
trainer.fit(model)
trainer.test(model)

# Get predictions on external test
import numpy as np

model.freeze()
test_loader = DataLoader(MNIST(os.getcwd(), train=False, download=True, transform=transforms.ToTensor()), batch_size=256)

y_true, y_pred = [],[]
for i, (x, y) in enumerate(test_loader):
    y_hat = model.forward(x).argmax(axis=1).cpu().detach().numpy()
    y = y.cpu().detach().numpy()

    y_true.append(y)
    y_pred.append(y_hat)

    if i == len(test_loader):
        break
y_true = np.hstack(y_true)
y_pred = np.hstack(y_pred)

# Log additional metrics
from sklearn.metrics import accuracy_score

accuracy = accuracy_score(y_true, y_pred)
neptune_logger.experiment.log_metric('test_accuracy', accuracy)

# Log charts
from scikitplot.metrics import plot_confusion_matrix
import matplotlib.pyplot as plt

fig, ax = plt.subplots(figsize=(16, 12))
plot_confusion_matrix(y_true, y_pred, ax=ax)
neptune_logger.experiment.log_image('confusion_matrix', fig)

# Save checkpoints folder
neptune_logger.experiment.log_artifact(CHECKPOINTS_DIR)

# You can stop the experiment
neptune_logger.experiment.stop()
This article was originally written by Jakub Czakon and posted on the Neptune blog. You can find more in-depth articles for machine learning practitioners there.
