Sometimes, existing commercial or out-of-the-box open-source tools like Grafana don't fit requirements for Nginx log analytics. Whether it is pricing, privacy, or customization issues, it is always good to know how to build such a system internally.
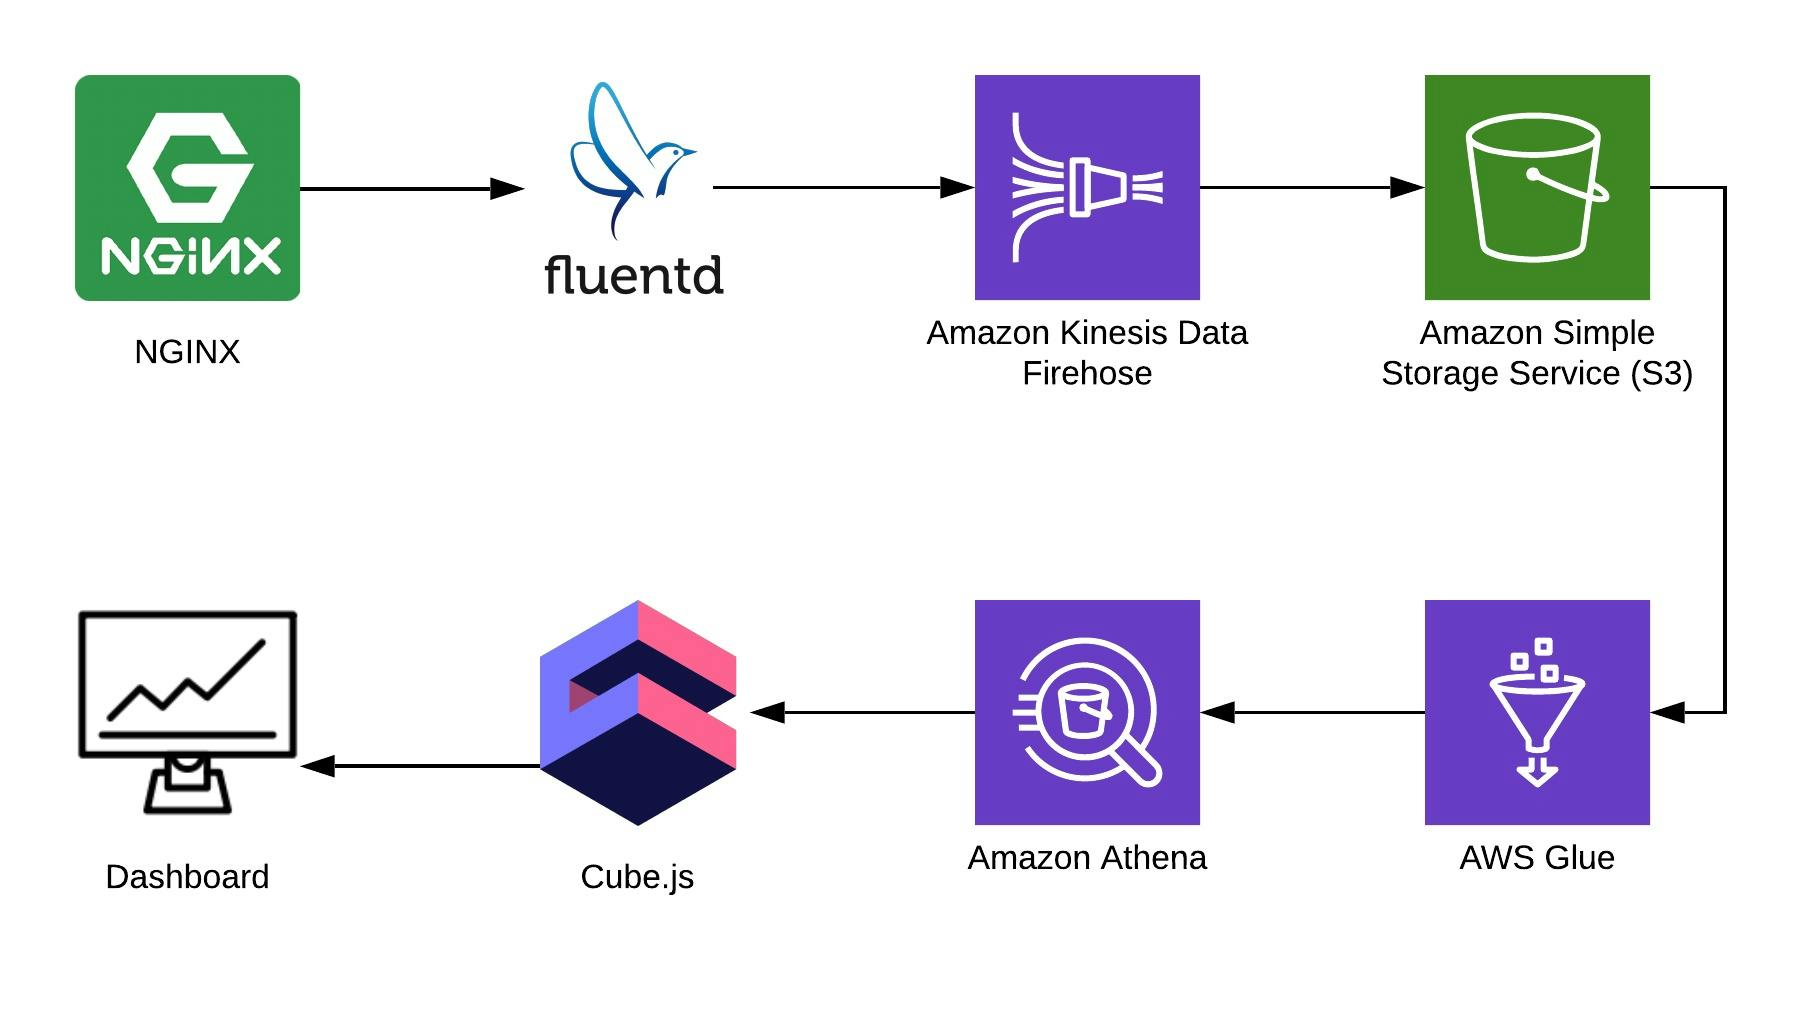
In the following tutorial, I'll show you how to build your own Nginx log analytics with Fluentd, Kinesis Data Firehose, Glue, Athena, and Cube.js. This stack also makes it easy to add data from other sources, such as Snowplow events, into the same S3 bucket and merge results in Athena. I'll walk you through the whole pipeline from data collection to the visualization.
Here is the live demo of the final dashboard.
Here's a sample architecture of the application we're going to build:
Collecting Nginx Logs
By default, Nginx writes logs in a plain text format like this:
4/9/2019 12:58:17 PM1.1.1.1 - - [09/Apr/2019:09:58:17 +0000] "GET /sign-up HTTP/2.0" 200 9168 "example.com/sign-in" "Mozilla/5.0 (Macintosh; Intel Mac OS X 10_14_4) AppleWebKit/537.36 (KHTML, like Gecko) Chrome/73.0.3683.86 Safari/537.36" "-"
4/9/2019 12:58:17 PM1.1.1.1 - - [09/Apr/2019:09:58:17 +0000] "GET /sign-in HTTP/2.0" 200 9168 "example.com/sign-up" "Mozilla/5.0 (Macintosh; Intel Mac OS X 10_14_4) AppleWebKit/537.36 (KHTML, like Gecko) Chrome/73.0.3683.86 Safari/537.36" "-"
Although we can parse that, it would be much easier to change Nginx configuration to use the JSON format.
log_format json_combined escape=json '{ "created_at": "$msec", '
            '"remote_addr": "$remote_addr", '
            '"remote_user": "$remote_user", '
            '"request": "$request", '
            '"status": $status, '
            '"bytes_sent": $bytes_sent, '
            '"request_length": $request_length, '
            '"request_time": $request_time, '
            '"http_referrer": "$http_referer", '
            '"http_x_forwarded_for": "$http_x_forwarded_for", '
            '"http_user_agent": "$http_user_agent" }';

access_log  /var/log/nginx/access.log  json_combined;
Create an S3 Bucket
Create a new S3 bucket for the log files. Note that logs should be placed in the root of the bucket and no other data can be stored in that bucket. Also, consider using the same region as your Athena because Athena is not available in some regions.
Define a Table Schema via the Athena Console
Open your Athena console and select the database you'd be using. To create a table, you can use AWS UI or just run create statement in the console.
CREATE EXTERNAL TABLE `kinesis_logs_nginx`(
  `created_at` double,
  `remote_addr` string,
  `remote_user` string,
  `request` string,
  `status` int,
  `bytes_sent` int,
  `request_length` int,
  `request_time` double,
  `http_referrer` string,
  `http_x_forwarded_for` string,
  `http_user_agent` string)
ROW FORMAT SERDE
  'org.apache.hadoop.hive.ql.io.orc.OrcSerde'
STORED AS INPUTFORMAT
  'org.apache.hadoop.hive.ql.io.orc.OrcInputFormat'
OUTPUTFORMAT
  'org.apache.hadoop.hive.ql.io.orc.OrcOutputFormat'
LOCATION
  's3://<YOUR-S3-BUCKET>'
TBLPROPERTIES ('has_encrypted_data'='false');
Create a Kinesis Firehose Stream
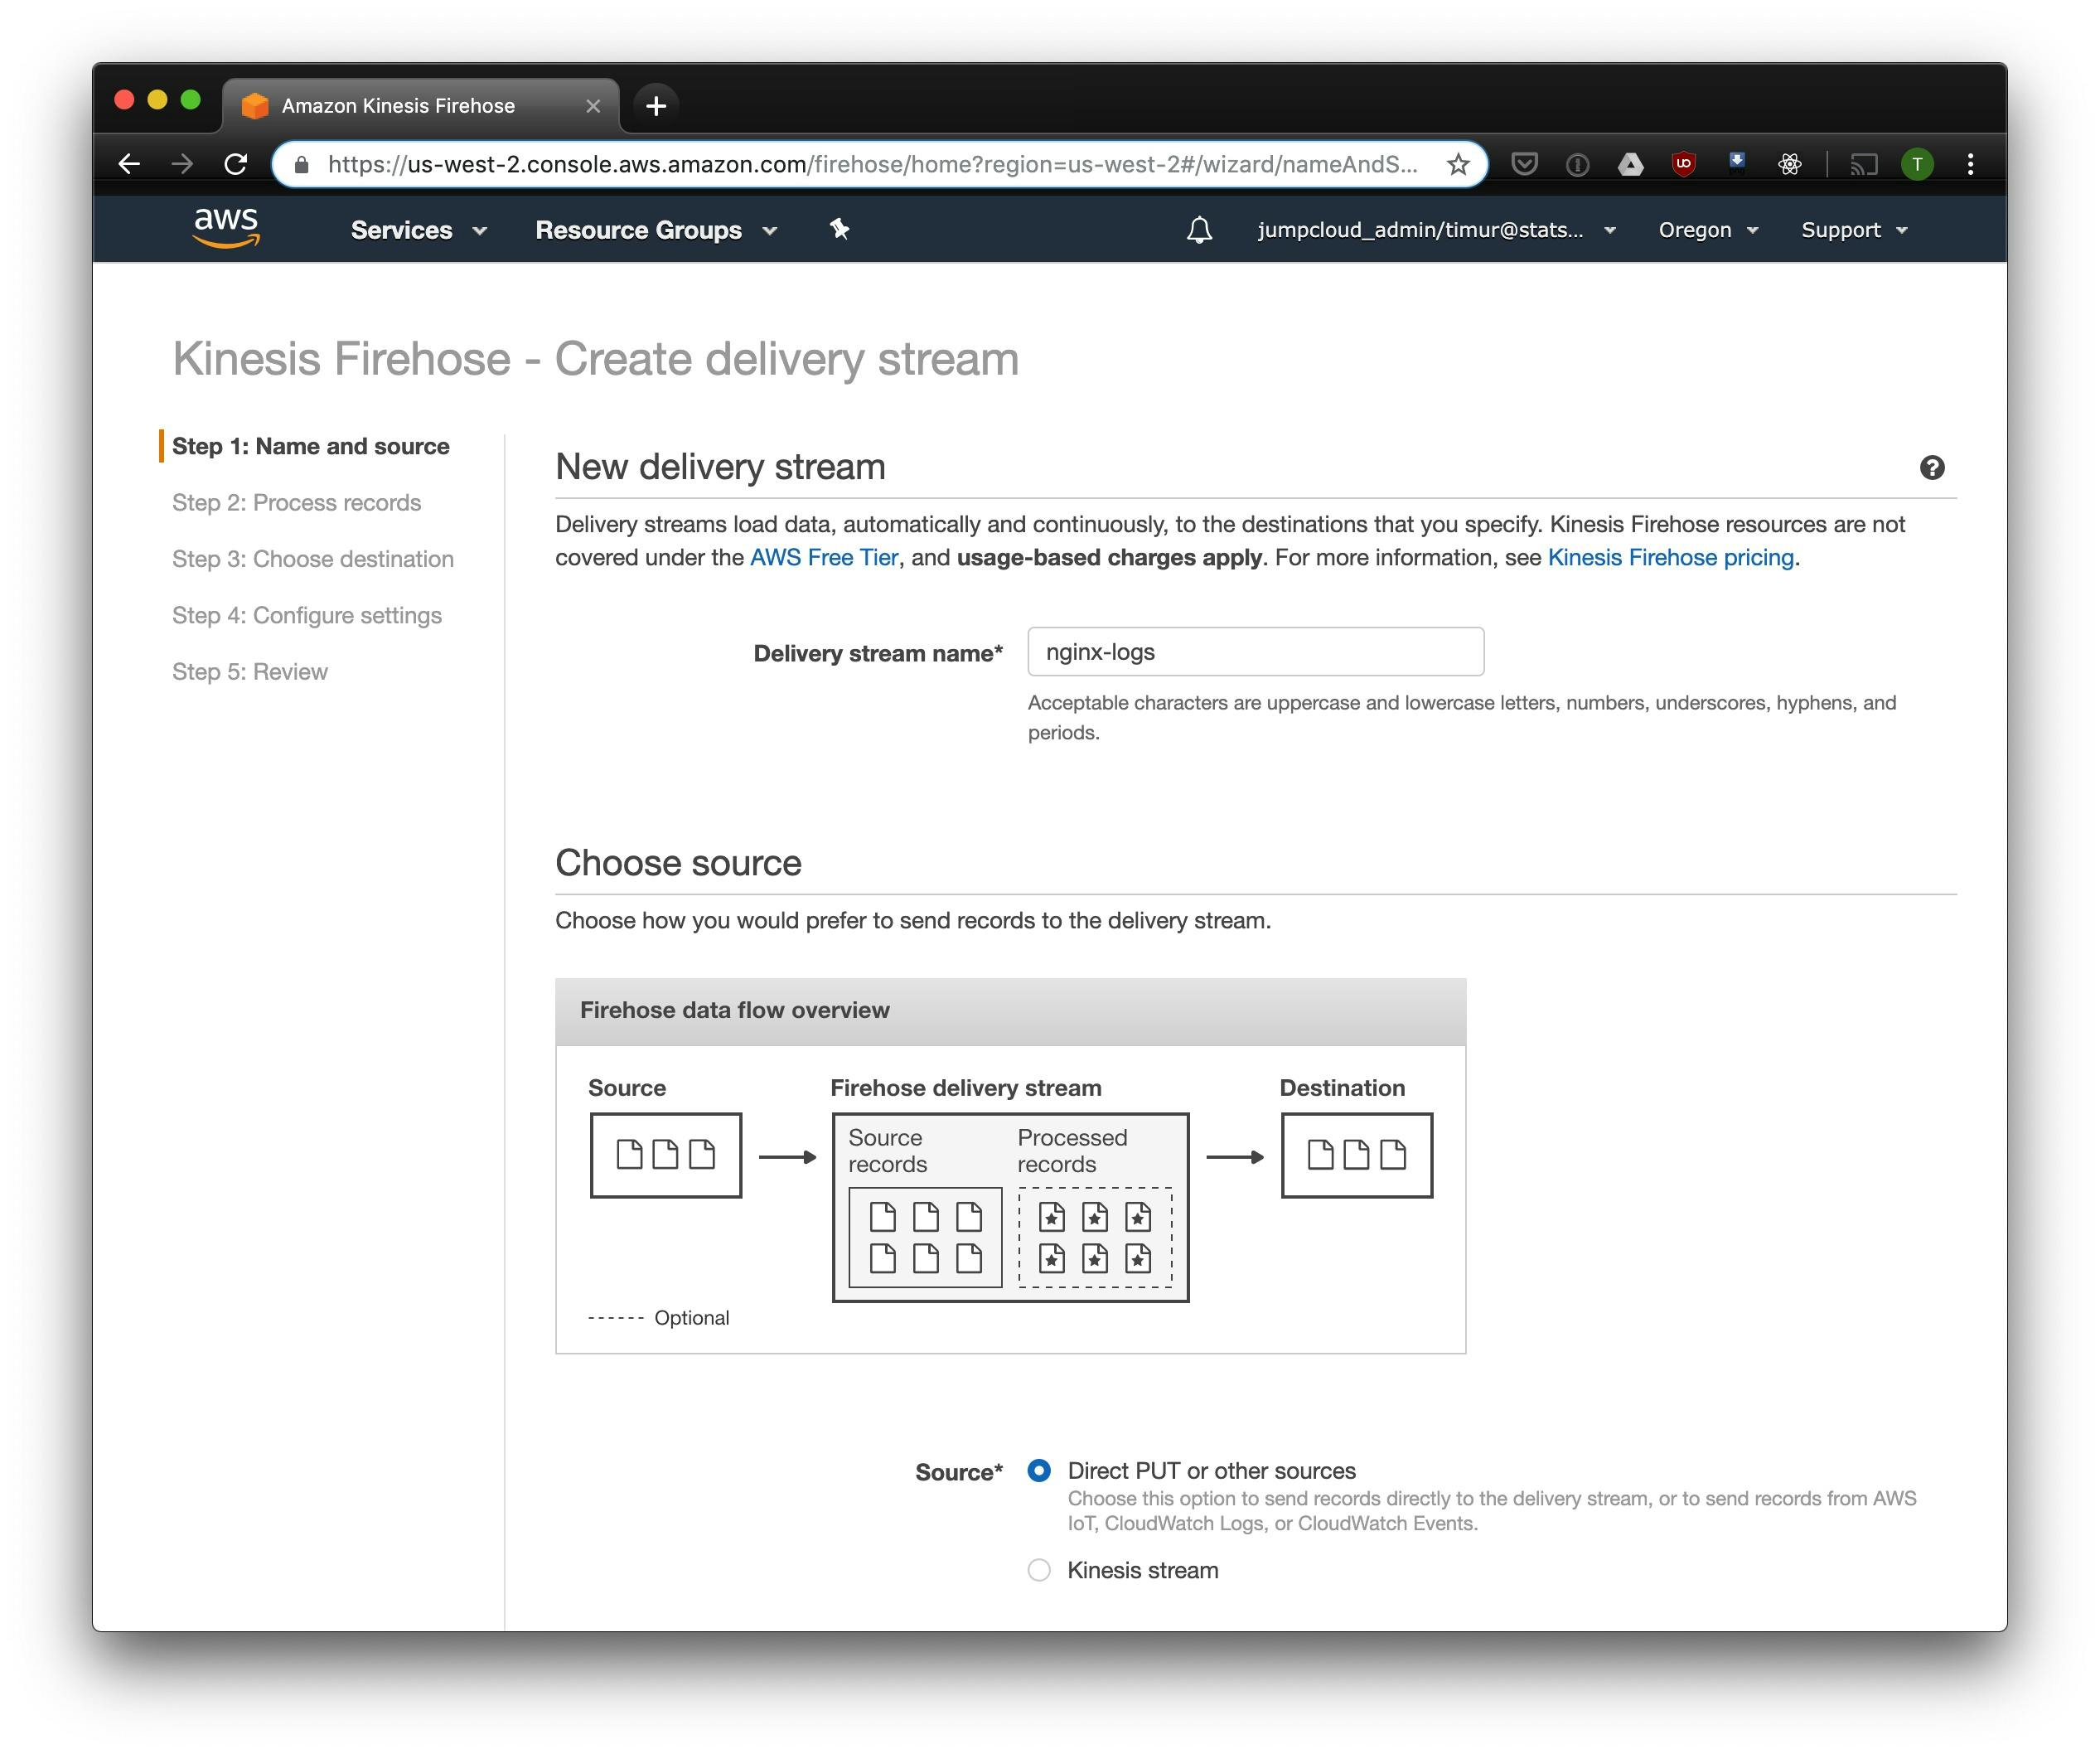
Open up the Kinesis Firehose console and click "Create delivery stream." Enter a name for the stream and set delivery to direct PUT.
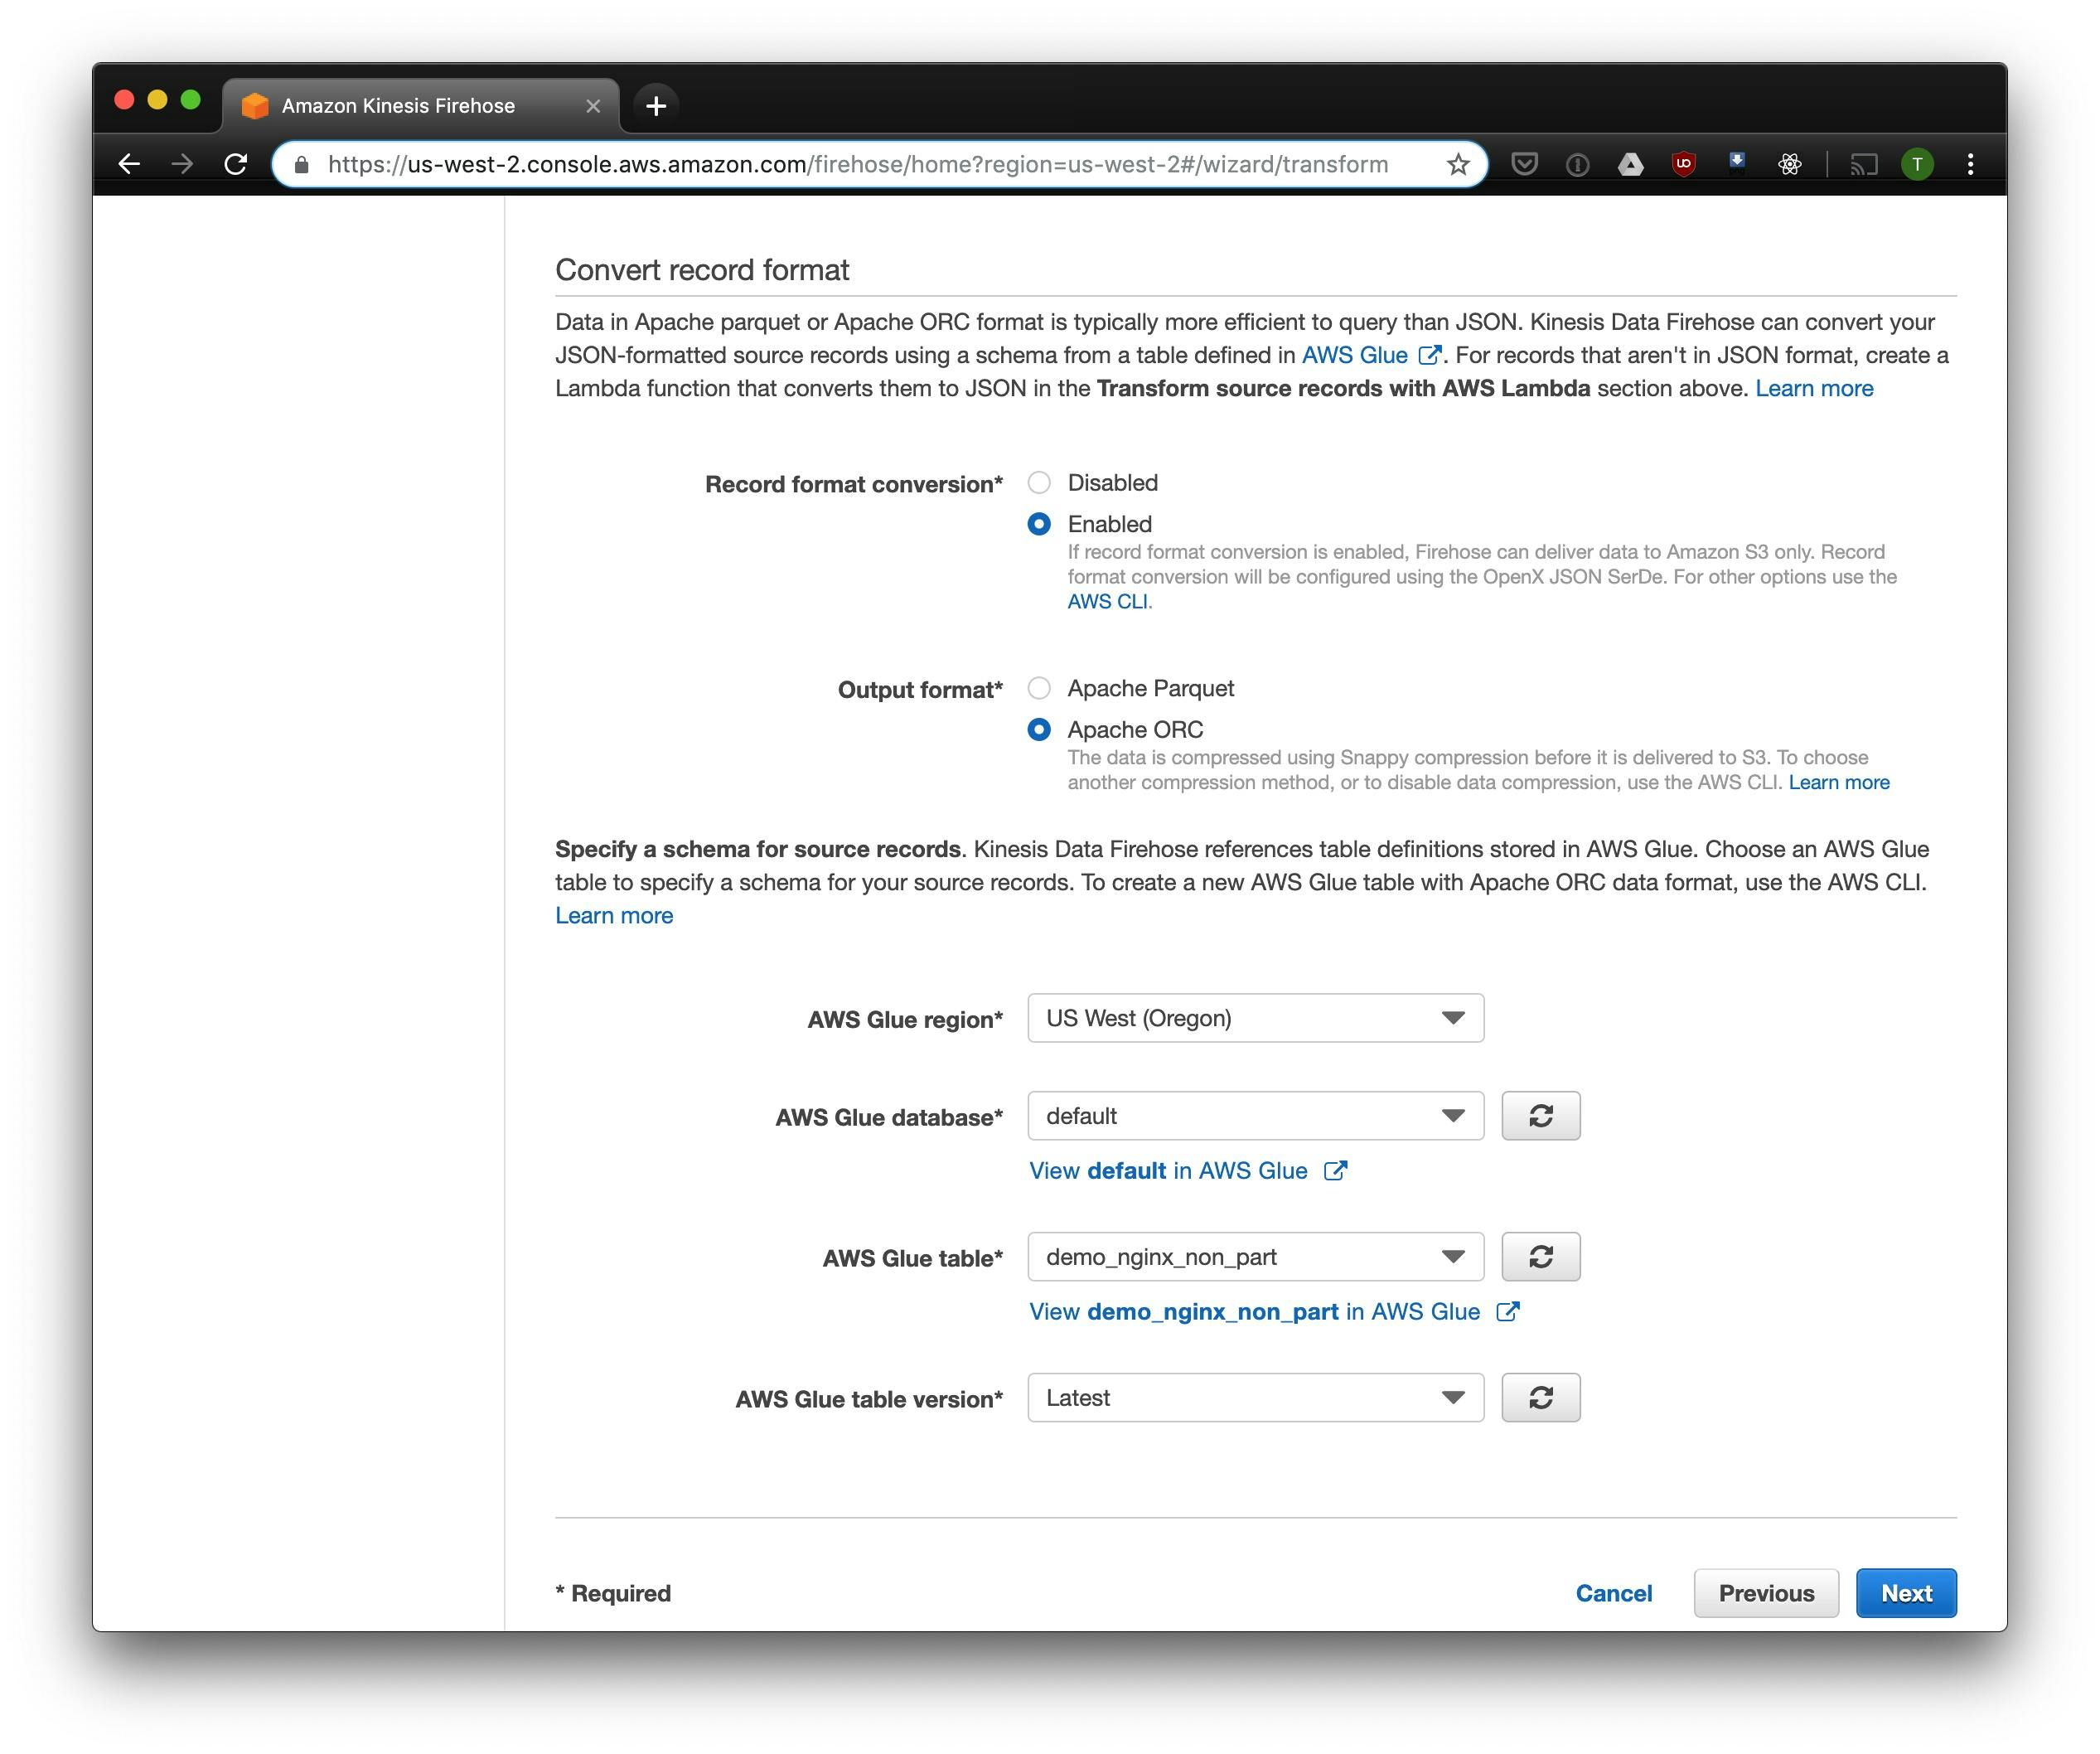
Click next. Select Record format conversion to Enabled, Output format to Apache ORC, and select the database you created as the schema source.
Select S3 as a storage format. Select the S3 bucket you created for log files and leave S3 Prefix empty.
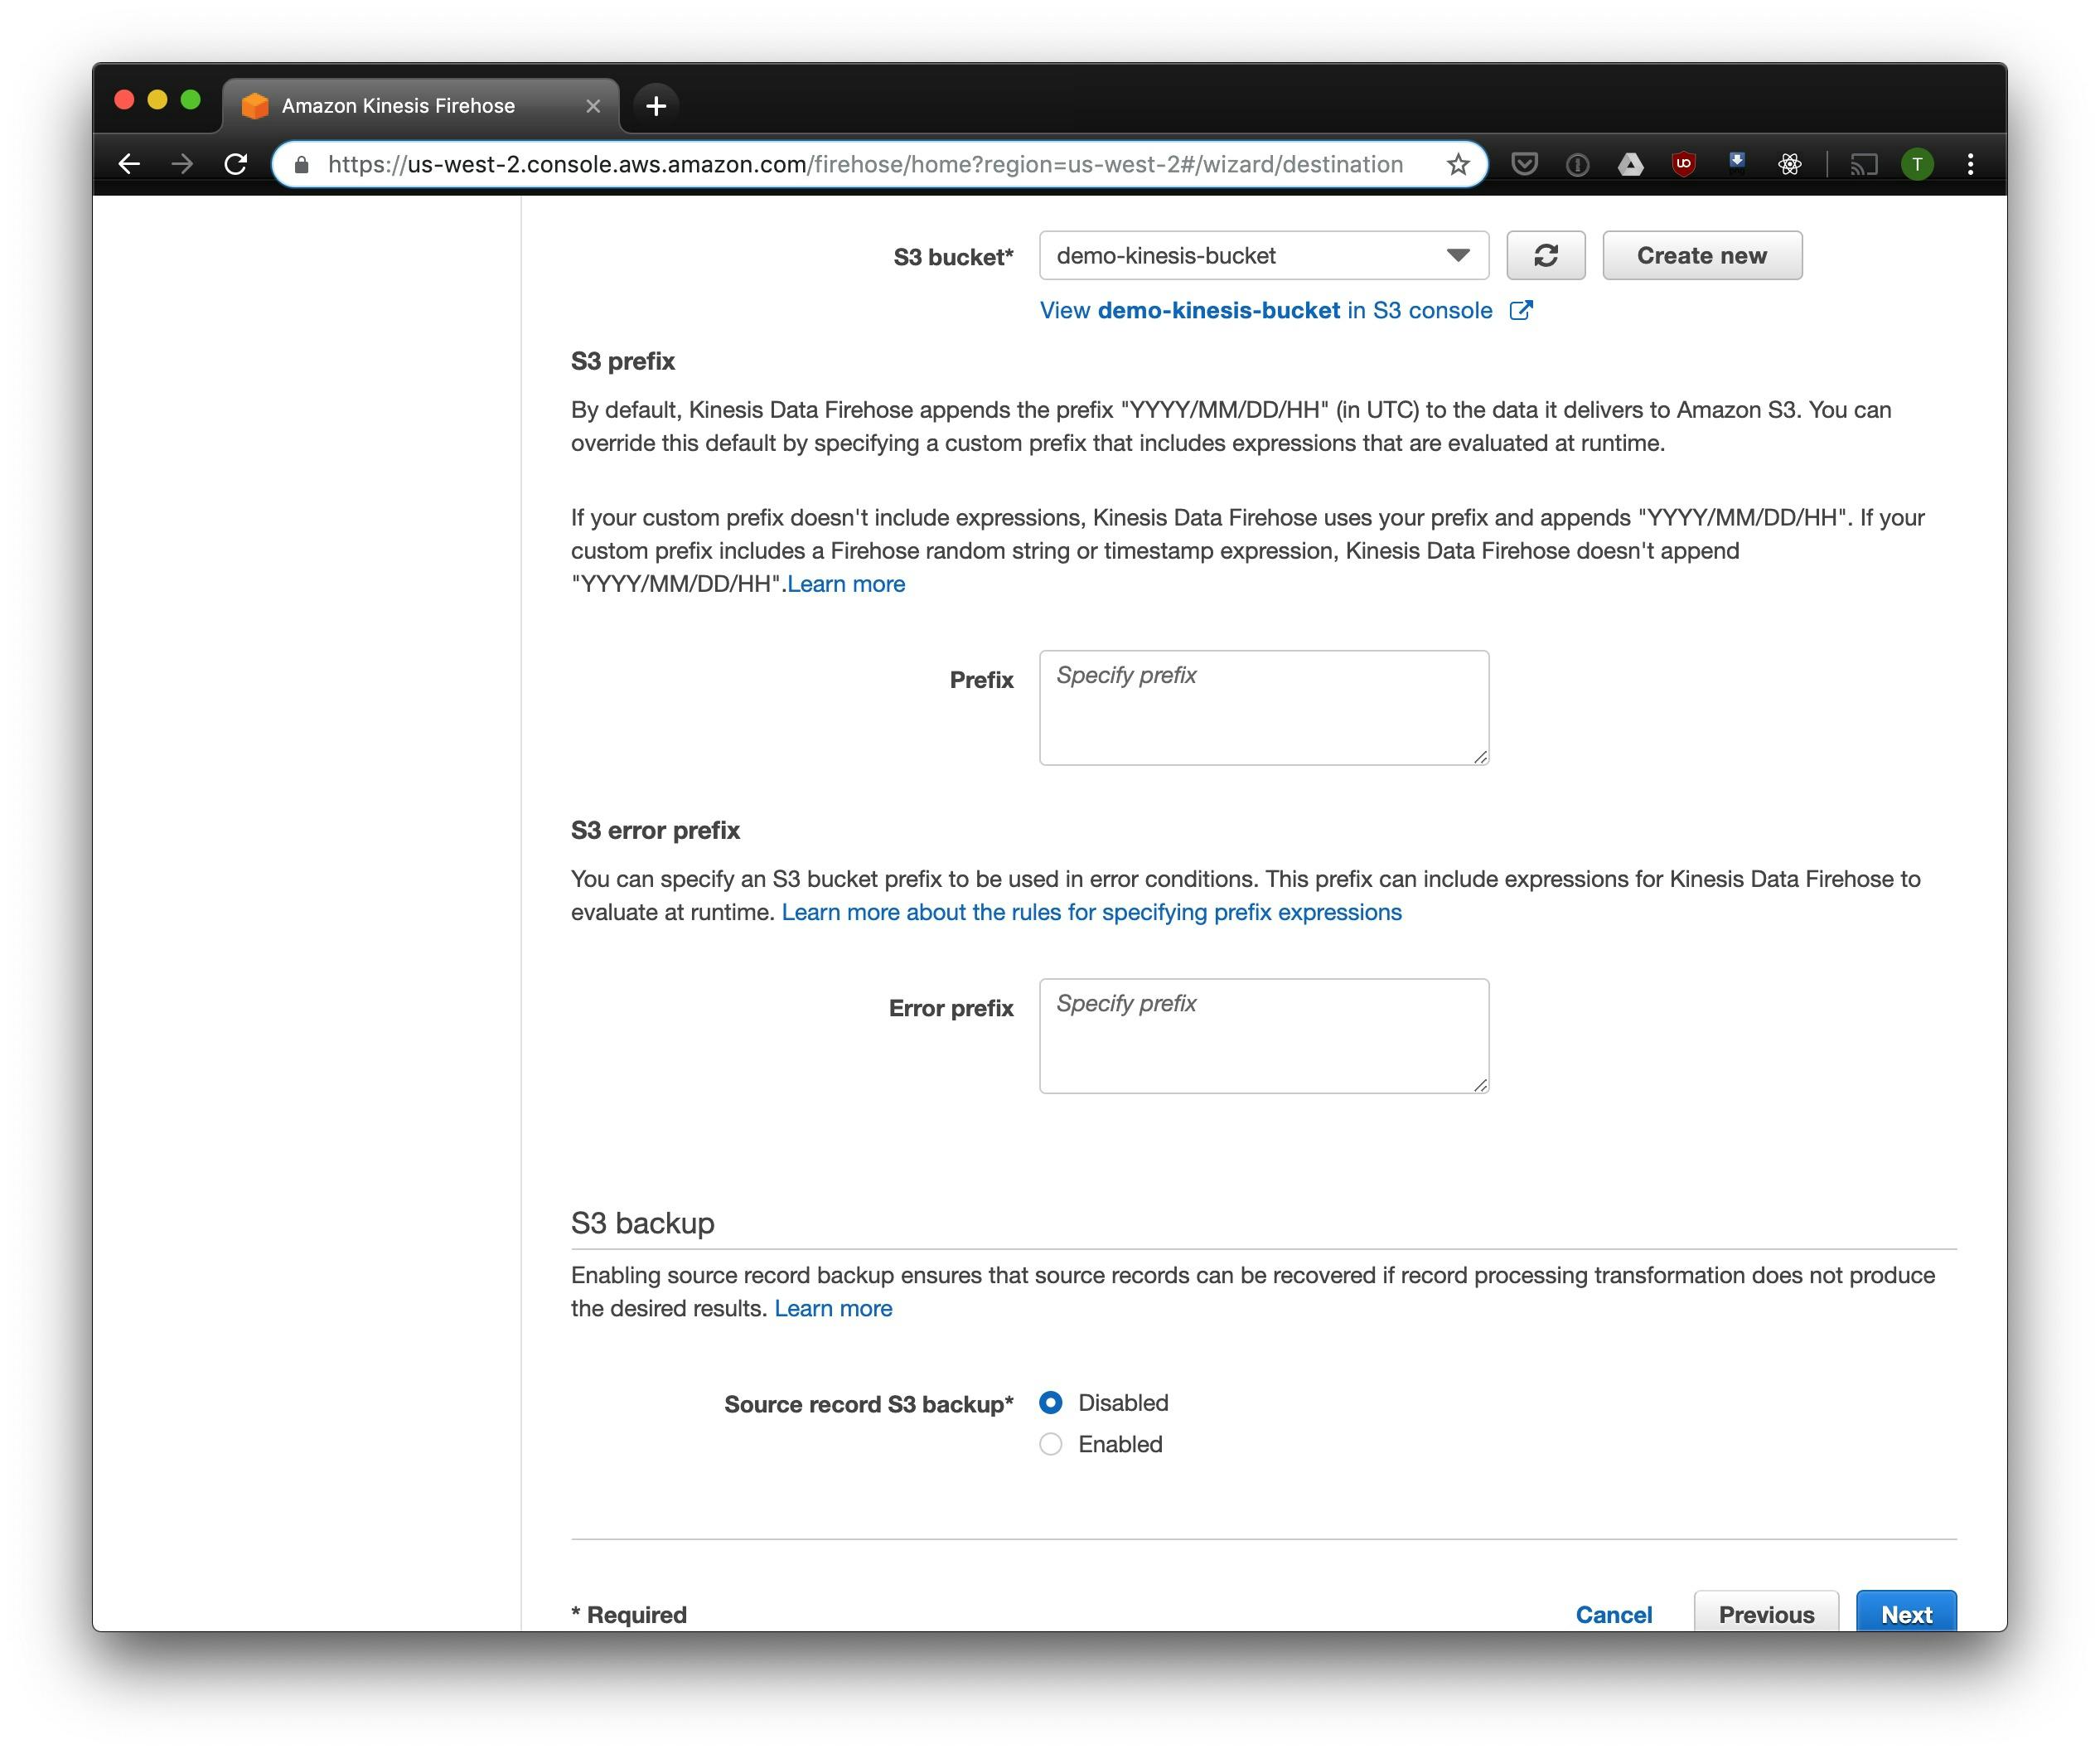
You can change other options depending on your load, but we'll continue with the default ones. S3 compression is not available since the ORC format includes compression. Now you've created the Kinesis Firehose stream!
Fluentd
There are many different ways to install and use Fluentd. We'll stick with the Docker version.
First, create a fluent.conf file and add a new Fluentd source to collect logs:
<source>
  @type forward
  port 24224
  bind 0.0.0.0
</source>
Now we can run a Fluentd server with this configuration. Here's a basic configuration; you can check out other options on Docker Hub.
$ docker run \
  -d \
  -p 24224:24224 \
  -p 24224:24224/udp \
  -v /data:/fluentd/log \
  -v <PATH-TO-FLUENT-CONF>:/fluentd/etc fluentd \
  -c /fluentd/etc/fluent.conf
  fluent/fluentd:stable
This configuration uses the /fluentd/log path for cache files. You can run Fluentd in Docker without mounting the data directory, but in the case of a restart, you can lose all cached logs. Also, you can change the default 24224 port to any other unused port. Now, as we have a running Fluentd server, we can stream Nginx logs to it.
Since we run Nginx in Docker, we can run it with the built-in docker Fluentd log driver:
$ docker run \
--log-driver=fluentd \
--log-opt fluentd-address=<FLUENTD-SERVER-ADDRESS>\
--log-opt tag=\"{{.Name}}\" \
-v /some/content:/usr/share/nginx/html:ro \
-d \
nginx
We'll use the Amazon Kinesis Output Plugin. It can store logs captured from Nginx as ORC files.
Next, select the Nginx log using tag prefix match and parse JSON:
<filter YOUR-NGINX-TAG.*>
  @type parser
  key_name log
  emit_invalid_record_to_error false
  <parse>
    @type json
  </parse>
</filter>
We're using the kinesis_firehose output plugin to send parsed logs to Kinesis Firehose:
<match YOUR-NGINX-TAG.*>
    @type kinesis_firehose
    region region
    delivery_stream_name <YOUR-KINESIS-STREAM-NAME>
    aws_key_id <YOUR-AWS-KEY-ID>
    aws_sec_key <YOUR_AWS-SEC_KEY>
</match>
Athena
Now you can query Nginx logs in Athena with SQL. Let's find some recent errors:
SELECT * FROM "db_name"."table_name" WHERE status > 499 ORDER BY created_at DESC limit 10;
Full Scan for Each Request
Now we have logs parsed and delivered to S3 in the ORC format, which is compressed and efficient to query. Also, Kinesis Firehose partitions logs by date and hour, but querying and filtering them requires Athena to scan all files. This is a problem, because the more logs you store, the more data gets scanned per request. It is slow and also pricey, because Athena pricing depends on scanned data volume.
To solve this, we'll use AWS Glue Crawler, which gathers partition data from S3 and writes it to the Glue Metastore. Once data is partitioned, Athena will only scan data in selected partitions. It makes querying much more efficient in terms of time and cost.
Setting an Amazon Glue Crawler
Amazon Glue Crawler can scan the data in the bucket and create a partitioned table for that data.
Create a Glue Crawler and add the bucket you use to store logs from Kinesis. You can add multiple buckets to be scanned on each run, and the crawler will create separate tables for each bucket. Make sure to schedule this crawler to run periodically depending on your needs. We usually run a single crawler for all buckets every hour. Also, it's easier to use a separate database for all crawled tables.
Partitioned Tables
Open your Athena console and choose the database you selected in the crawler configuration. After the first run of the crawler, you should see a table named the same as the S3 bucket where all log files are located. You can query results for some hours and filter the data by partitions.
SELECT * FROM "default"."part_demo_kinesis_bucket"
WHERE(
  partition_0 = '2019' AND
  partition_1 = '04' AND
  partition_2 = '08' AND
  partition_3 = '06'
  );
This query will select all events that came from 6 AM to 7 AM on April 8, 2019.
Did that help? Let's run the same request without a partition filter.

You can see that the query took 3.59 seconds to run and processed 244.34 megabytes of data. Let's use partition helpers:
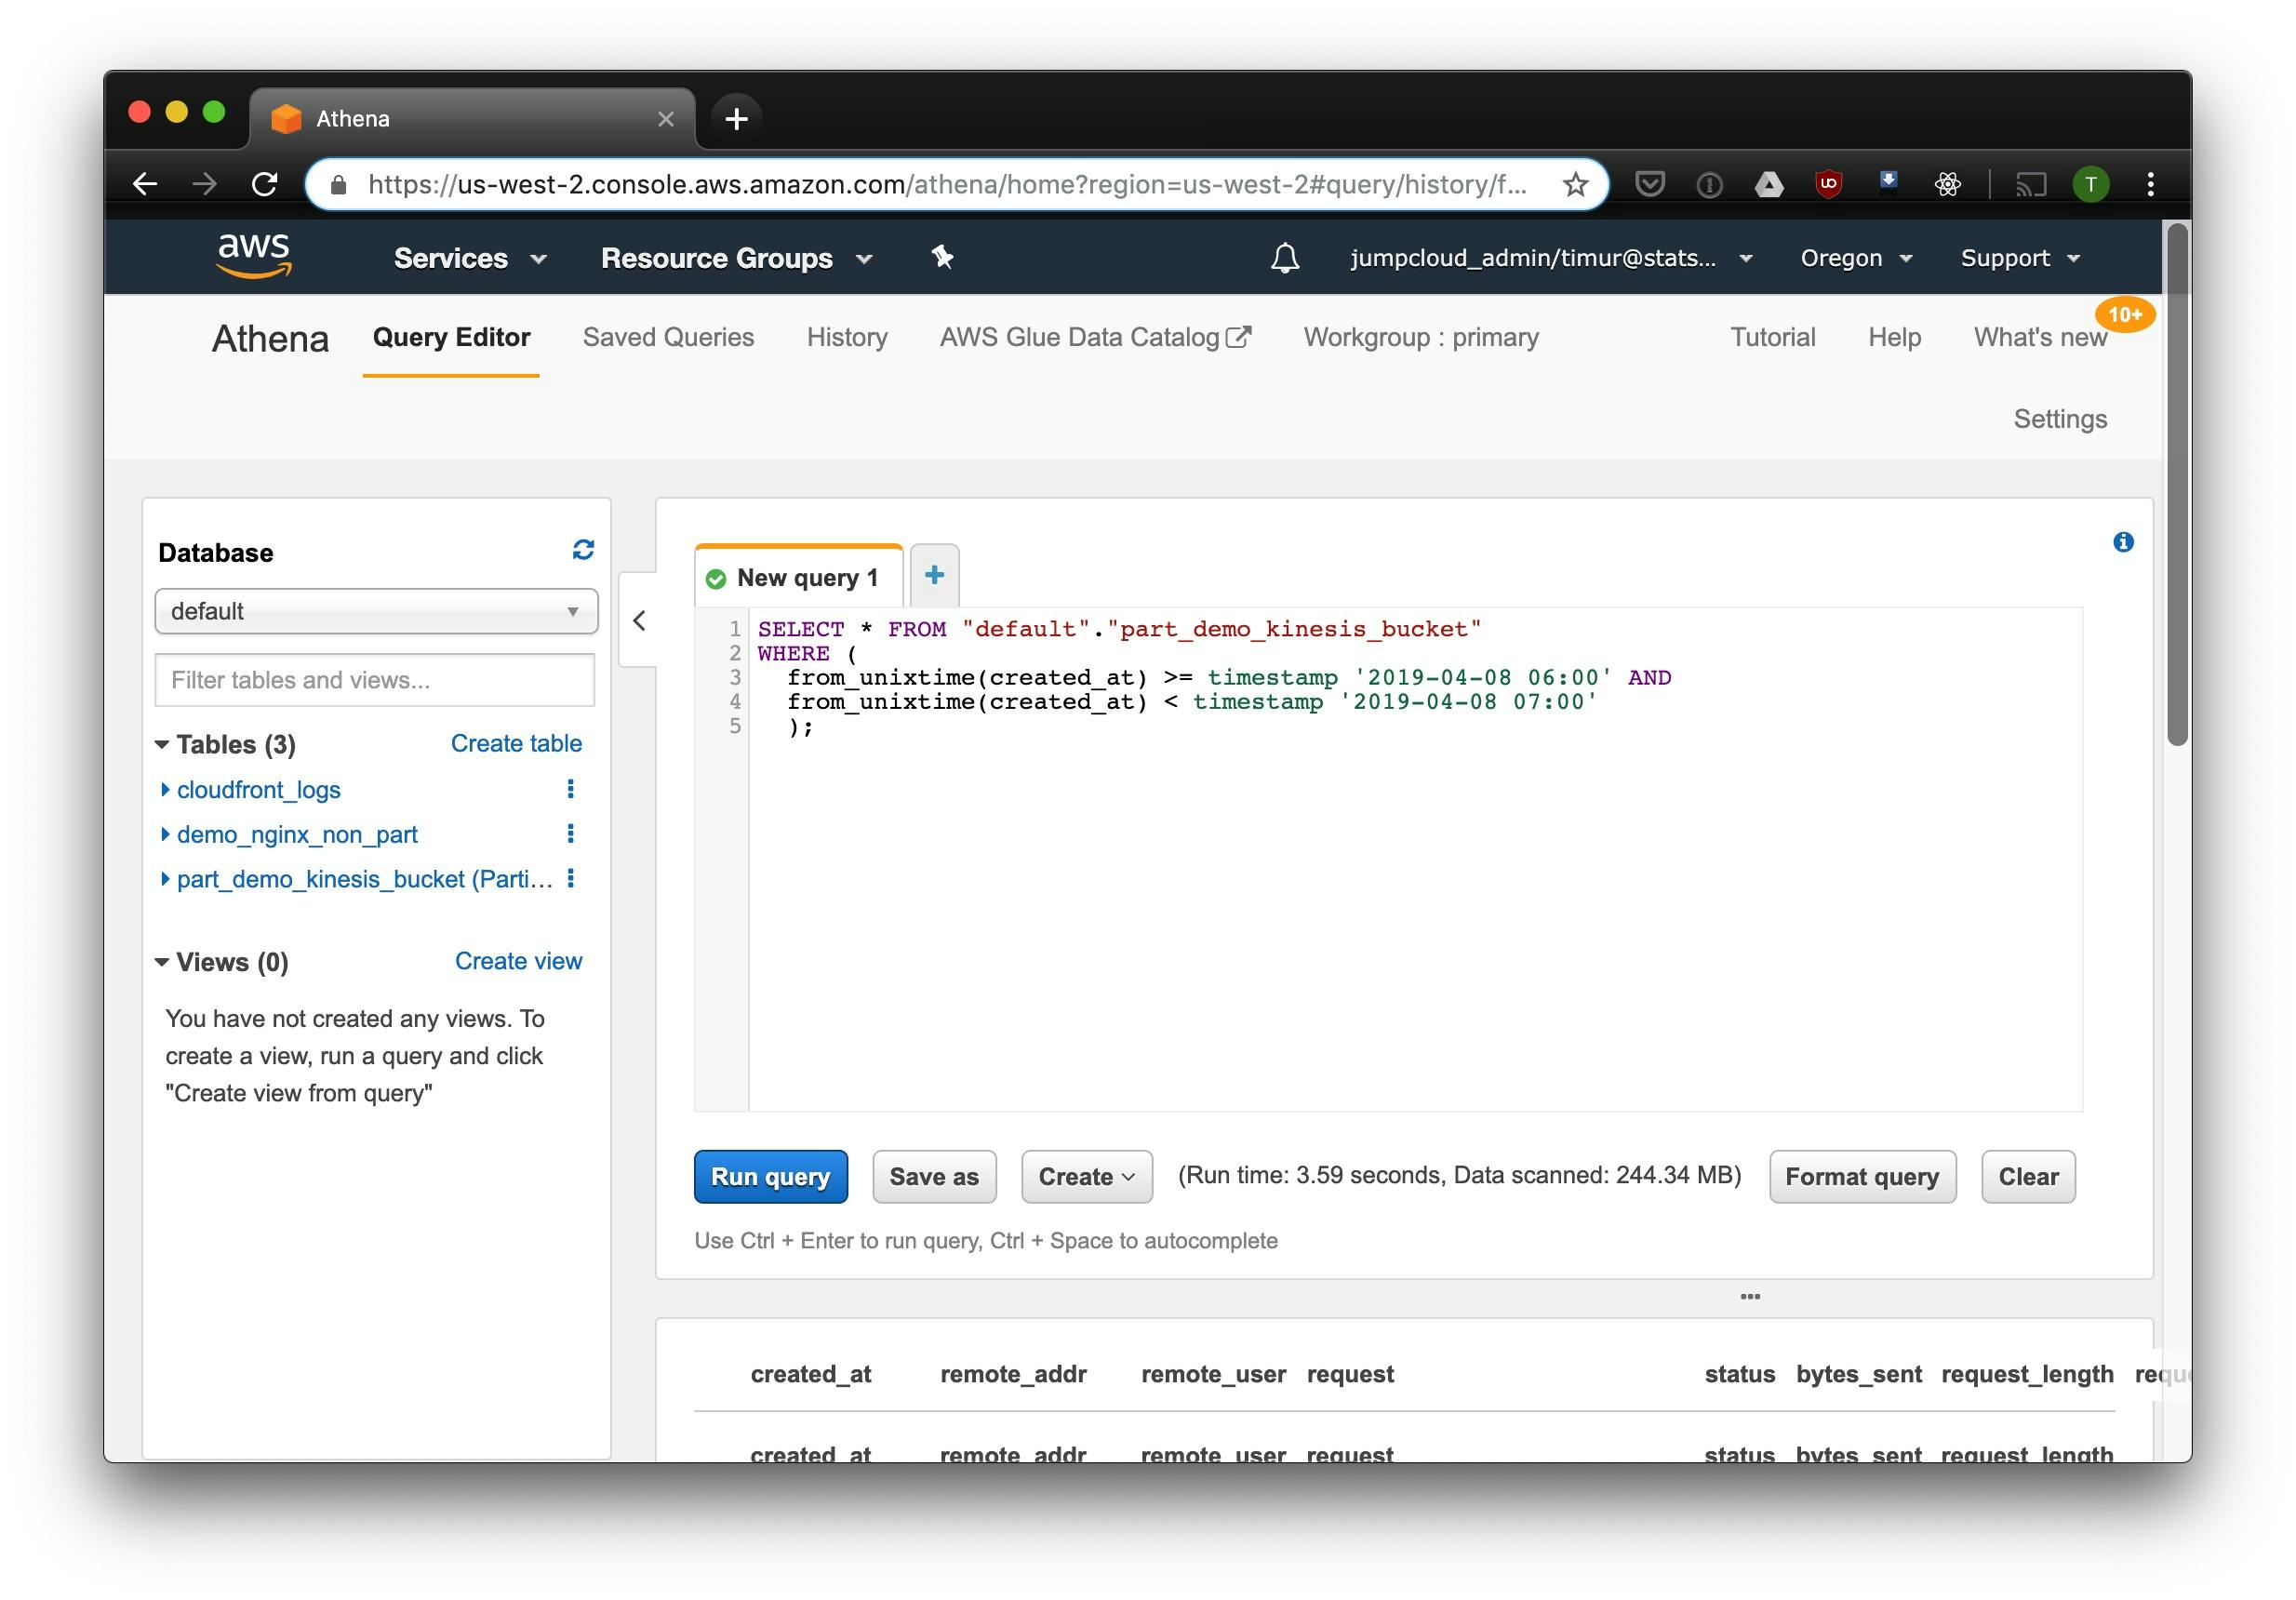
This query is a bit faster and, more importantly, took only 1.23 megabytes of scanned data. On larger datasets, the difference grows dramatically.
Building a Dashboard with Cube.js
We will use Cube.js to query Athena and build a dashboard. It has plenty of powerful features, but the main reasons we would want to use it, in this case, are automatic handling of partitions and pre-aggregations.
Cube.js can dynamically generate SQL, taking care of partitioning. It uses data schema, which is written in Javascript, to generate SQL. We can put instructions on how to filter partitions in the data schema.
Let's create a new Cube.js app with a serverless deployment option. Since we're using Athena, serverless is the easiest way to deploy. If you prefer other deployment environments, such as Docker or Heroku, you can check the documentation on deployment options here.
$ npm install -g cubejs-cli
$ cubejs create nginx-log-analytics -t serverless -d athena
Cube.js uses environment variables for database credentials. On new app creation, the CLI generates the .env file with placeholders in the project directory. Fill it with your Athena credentials.
Now, we can create a data schema file, where we'll define how Cube.js should query the Athena logs table, as well as measures and dimensions for our dashboard. If you are just getting started with Cube.js, I recommend checking this or that tutorial to learn more about data schemas and how Cube.js generates SQL.
In the schema folder, create the file Logs.js with the following content:
const partitionFilter = (from, to) => `
    date(from_iso8601_timestamp(${from})) <= date_parse(partition_0 || partition_1 || partition_2, '%Y%m%d') AND
    date(from_iso8601_timestamp(${to})) >= date_parse(partition_0 || partition_1 || partition_2, '%Y%m%d')
    `

cube(`Logs`, {
  sql: `
  select * from part_demo_kinesis_bucket
  WHERE ${FILTER_PARAMS.Logs.createdAt.filter(partitionFilter)}
  `,

  measures: {
    count: {
      type: `count`,
    },

    errorCount: {
      type: `count`,
      filters: [
        { sql: `${CUBE.isError} = 'Yes'` }
      ]
    },

    errorRate: {
      type: `number`,
      sql: `100.0 * ${errorCount} / ${count}`,
      format: `percent`
    }
  },

  dimensions: {
    status: {
      sql: `status`,
      type: `number`
    },

    isError: {
      type: `string`,
      case: {
        when: [{
          sql: `${CUBE}.status >= 400`, label: `Yes`
        }],
        else: { label: `No` }
      }
    },

    createdAt: {
      sql: `from_unixtime(created_at)`,
      type: `time`
    }
  }
});
In the top level sql expression for the Logs cube, we are using the FILTER_PARAMS feature of Cube.js to dynamically generate SQL based on the passed filter parameters.
We also define measures and dimensions we'll use in our dashboard. One last thing to do before building a frontend is to set up pre-aggregations. The Cube.js pre-aggregation engine builds a layer of aggregated data in your database during the runtime and keeps it up-to-date. It can significantly speed up the performance and also in the case of Athena reduce billing as well. This guide covers using pre-aggregations in more details.
To add it to our schema, add the following block to the end of the cube definition.
preAggregations: {
  main: {
    type: `rollup`,
    measureReferences: [count, errorCount],
    dimensionReferences: [isError, status],
    timeDimensionReference: createdAt,
    granularity: `day`,
    partitionGranularity: `month`,
    refreshKey: {
      sql: FILTER_PARAMS.Logs.createdAt.filter((from, to) =>
        `select
           CASE WHEN from_iso8601_timestamp(${to}) + interval '3' day > now()
           THEN date_trunc('hour', now()) END`
      )
    }
  }
}
We're pre-aggregating all the measures and dimensions we'll use and also making this pre-aggregation to be partitioned by month. Partitioning pre-aggregations can dramatically increase background refresh time.
Now, we are ready to build our frontend dashboard.
Cube.js provides REST API, a Javascript client, and bindings for popular frameworks, such as React and Vue. The clients are visualization agnostic and take care of API calls and data formatting, letting developers use any visualization library.
The Cube.js server accepts a query in a JSON format with measures and dimensions. It then generates and executes SQL against Athena, and sends the result back. For example, to load the count of requests with an error over time by day, we can use the following request:
{
  "measures": ["Logs.errorCount"],
  "timeDimensions": [
    {
      "dimension": "Logs.createdAt",
      "dateRange": ["2019-01-01", "2019-01-07"],
      "granularity": "day"
    }
  ]
}
You can install the Cube.js Javascript Client and React binding with NPM.
$ npm i --save @cubejs-client/core @cubejs-client/react
Then import the cubejs and QueryRenderer components, and use them to fetch the data. In the example below, we use Recharts to visualize data.
import React from 'react';
import { LineChart, Line, XAxis, YAxis } from 'recharts';
import cubejs from '@cubejs-client/core';
import { QueryRenderer } from '@cubejs-client/react';

const cubejsApi = cubejs(
  'YOUR-CUBEJS-API-TOKEN',
  { apiUrl: 'localhost:4000/cubejs-api/v1' },
);

export default () => {
  return (
    <QueryRenderer
      query={{
        measures: ['Logs.errorCount'],
        timeDimensions: [{
            dimension: 'Logs.createdAt',
            dateRange: ['2019-01-01', '2019-01-07'],
            granularity: 'day'
        }]
      }}
      cubejsApi={cubejsApi}
      render={({ resultSet }) => {
        if (!resultSet) {
          return 'Loading...';
        }

        return (
          <LineChart data={resultSet.rawData()}>
            <XAxis dataKey="Logs.createdAt"/>
            <YAxis/>
            <Line type="monotone" dataKey="Logs.errorCount" stroke="#8884d8"/>
          </LineChart>
        );
      }}
    />
  )
}
This tutorial goes into great detail on how to build dashboards with Cube.js.
You can find a CodeSandbox with a demo dashboard built with React and Cube.js below.