Probability and Statistics for Data science-A beginner’s Approach.


There is not even a single day in your life when you don’t think about using probability and statistics. Deciding between two options, either on what to cook, what courses to take, even down to the mushy things, either to say yes or no to him/her(I hope you say yes😁), making predictions, learning weather forecast, creating hypotheses are all important aspects of probability.
Probability and Statistics form the basis of Data Science. The probability theory is very much helpful for making the prediction which is important in Data science while statistical methods, help us make estimates for further analysis. Thus, statistical methods are largely dependent on the theory of probability. And all of probability and statistics is dependent on Data. In this article I will be sharing basics of Probability and statistics for Data science to help Beginners like myself.
Probability
Probability is simply how likely something is to happen. It implies 'likelihood' or 'chance’. When an event is certain to happen then the probability of occurrence of that event is 1 and when it is not certain that the event can’t happen, the probability of the event is 0.Hence,its safe to say, the value of probability ranges from 0 to 1.
Notationally , the probability of event A is represented by P(A).
If P(A) equals zero, event A will almost definitely not occur.
If P(A) is close to zero, there is only a small chance that event A will occur.
If P(A) equals 0.5, there is a 50-50 chance that event A will occur.
If P(A) is close to one, there is a strong chance that event A will occur. If P(A) equals one, event A will almost definitely occur.
In a statistical experiment, the sum of probabilities for all possible outcomes is equal to one. This means, for example, that if an experiment can have three possible outcomes (A, B, and C), then P(A) + P(B) + P(C) = 1.
The best example for understanding probability is flipping a coin: There are two possible outcomes—heads or tails. What’s the probability of the coin landing on Heads? P(H) You might intuitively know that the likelihood is half/half, or 50%. But how do we work that out? Probability of an event = (# of ways it can happen) / (total number of outcomes) 1/2 = 50%
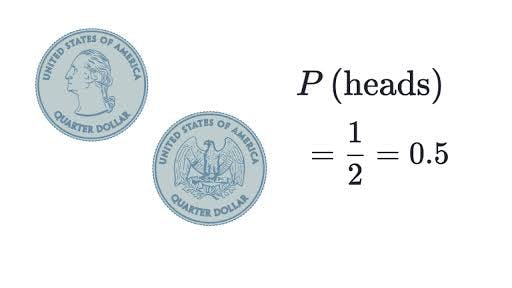 Image credit: khan Academy
Experimental Probability
Experimental probability is the relative frequency of an event with respect to the total number of times the experiment was performed. Simply put, the number of times an Event (E) happened / number of times we repeated the experiment. The more you toss the coin, the closer the P(H) gets to the true value.
Theoretical Probability
This is based under the assumption that the outcomes have equal chances of occurring. The probability that the experiment results in a successful outcome (S) is: P(S) = ( Number of successful outcomes ) / ( Total number of equally likely outcomes ) = r / n
Consider the following experiment: A bag has 10 marbles. Two marbles are red, three are green, and five are blue. If an experimenter randomly selects 1 marble from the bag, what is the probability that it will be green?
In this experiment, there are 10 equally likely outcomes, three of which are green marbles. Therefore, the probability of choosing a green marble is 3/10 or 0.30.
Types of events By “Event” I mean one (or more) outcomes. Events can be: Independent (each event is not affected by other events)
Dependent (also called “Conditional”, where an event is affected by other events)
Mutually Exclusive (events can’t happen at the same time) Here is a link to probability and its Terminologies for further study
Statistics
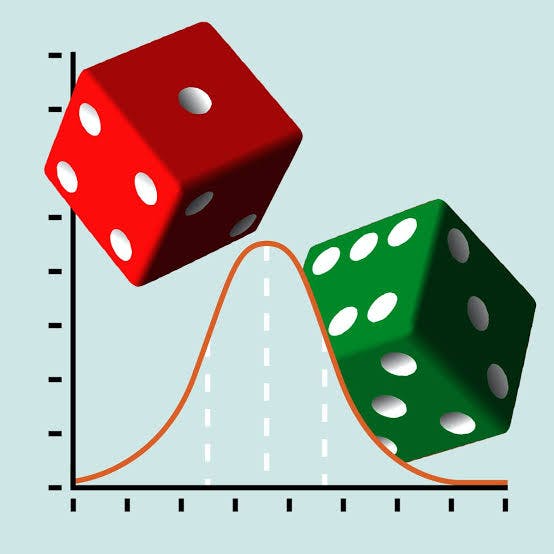
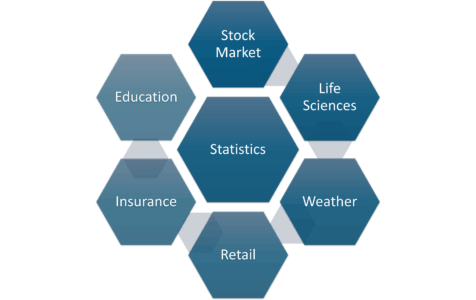
While statistics is all about analysis, it uses probability distributions and theories to make any data calculations and present it via graphs, charts, pictographs. The two disciplines are learned together to receive meaningful and relevant output in a business. They can serve many purposes from analyzing huge volumes of data, organizing it to present it in the simplest graphical manner. You should never, ever completely skip learning statistics and probability theory. It’s essential to progressing your career as a data scientist.
Image credit
Statistics-Applications-Math-And-Statistics-For-Data-cience-Edurek
The first step of every statistical analysis you will perform is to determine whether the dataset you are dealing with is a population or a sample. A population is a collection of all items of interest in your study whereas a sample is a subset of data points from that population. Let’s take a short refresher on statistics terminologies and concepts!
Population : it’s a number of something we are observing, humans, events, animals etc. It has some parameters such as the mean, median, mode, standard deviation, among others.
Sample: it is a random subset from the population. Usually you use samples when the population is big enough to difficult the analysis of the whole set. In a sample you don’t have parameters you have statistics.
Quantitative Analysis: Quantitative Analysis or Statistical Analysis is the science of collecting and interpreting data with numbers and graphs to identify patterns and trends.
Qualitative Analysis: Qualitative or Non-Statistical Analysis gives generic information and uses text, sound and other forms of media to do so.
Descriptive Statistics : Descriptive Statistics uses the data to provide descriptions of the population, either through numerical calculations or graphs or tables.
Here are 3 steps you can take to learn statistics and probability required for data science:
1 . Core Statistics Concepts: Descriptive statistics, distributions, hypothesis testing, and regression.
2. Bayesian Thinking: Conditional probability, priors, posteriors, and maximum likelihood.
3.Intro to Statistical Machine Learning: Learn basic machine concepts and how statistics fits in.
Click on the following links for further details and advanced learning. How to Learn Math for Data Science, The Self-Starter Way
Fun Machine Learning Projects for Beginners
Conclusion In this post, we have acquainted ourselves with basics of Probability and statistics . Also we have learnt the steps in starting out our probability and statistics journey in Data Science as beginners. I hope you found this helpful. Thanks for reading! Cheers to crunching data!!
WRITTEN BY
Olutola Awosiku
Avid Reader|| Healthtechie || Social innovator || STEM Educator ||