Many companies are moving to Kubernetes as the platform of choice for running software workloads. When an organization earlier using VMs in AWS decides to move to Kubernetes (Either EKS or self-managed in AWS), one of the questions that come up is should one continue to use Amazon CloudWatch or switch to some other tool like Prometheus? While CloudWatch vs Prometheus is not an exactly apple to apple comparison, there are reasons to explore this and choose tooling that is built for the future. This post will try to explore various aspects and pros and cons of both options individually and as a combination.
Why?
Prometheus and Amazon CloudWatch are very different in the problem they solve and a 1-1 comparison seems unfair, but as you start moving to cloud-native stack, Prometheus starts popping up in conversations and for many right reasons. For example, currently, CloudWatch does not support Kubernetes metrics (Issue link here). As one of the workarounds, you can use CloudWatch exporter and export metrics from CloudWatch to a Prometheus instance. You can also host a Prometheus instance in the cluster and then metrics are exported to CloudWatch using the CloudWatch adapter. Before we start comparing the two technologies, let’s do a quick high-level overview of both.
AWS CloudWatch Overview
AWS Cloudwatch is a native service within the suite of AWS services offered by Amazon. It helps collect metrics and logs for the AWS services and the applications running on these services to provide real-time visibility in their usage and behavior. In very simplistic terms, CloudWatch acts as a metrics sink. AWS services publish metrics to CloudWatch. These metrics are then used to configure alarms and statistics. The services which publish metrics to CloudWatch are listed in the documentation here.
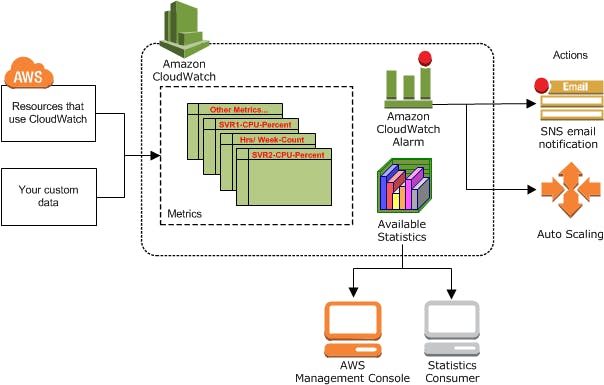
Working of AWS CloudWatch
An application or a service publishes metrics(a set of data points ordered by time) in a namespace (a construct to provide isolation of metrics for eg: AWS/EC2 or AWS/ApiGateway) with dimensions (an identity key/value pair used to filter and lookup metrics). Statistics are the aggregations performed over the reported unit (value) of the metrics over a period of time.
What is Prometheus?
Prometheus is an application used for monitoring and alerting, along with Grafana for dashboarding. It’s a popular and active CNCF supported open source project and it enjoys a lot of community support and integrations for other applications in the monitoring ecosystem.
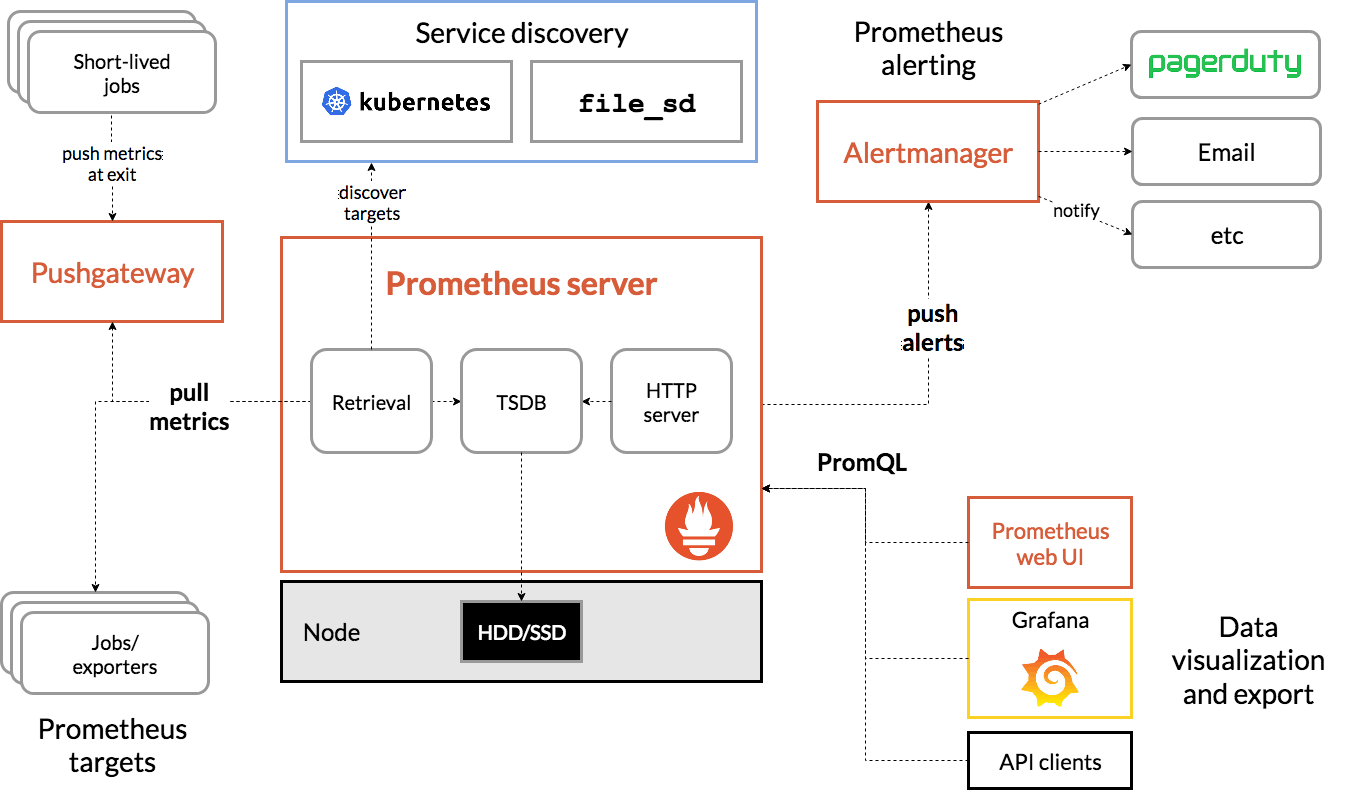
Working of Prometheus
An application exposes metrics (or uses the exporter to do so) at a specific endpoint scraped by the Prometheus server (this also acts as a sink for storing metric time-series data). Prometheus works on a pull-based mechanism where it scrapes metrics exposed by applications at a specific endpoint. It also supports a Push gateway component which is used to allow shortlived jobs such as cron and batch jobs to export their metrics. Prometheus exporters provide support for applications in exposing metrics in the Prometheus format. An Alert manager component provides support for managing alerts.
Let's Compare CloudWatch vs Prometheus
We will compare the two technologies primarily aimed at Kubernetes based cloud-native platform and explore which one fits the use cases better. One of the goals is also to find out when the “managed” CloudWatch starts to get costlier rather than managing Prometheus on your own. When we say “cost” here, it is not just the $ value – there are multiple aspects to it and we will discuss those as well.
Metric Support in Cloudwatch vs Prometheus
As noted earlier currently CloudWatch does not support monitoring a Kubernetes/EKS cluster (Issue link here). You can have core metric or custom metric at a standard resolution (granularity of a minute) or high resolution (granularity of a second). Specifically for pod autoscaling to work you will have to write an adapter and publish the metrics to Kubernetes API server. From integration to other tools such as PagerDuty etc., you will have to integrate using AWS SQS or similar tooling.
Prometheus supports scraping Kubernetes metrics natively and is well integrated with API server for autoscaling. It also comes with support for custom metrics and most commonly used use cases will have a community developed adapter ready to use.
One of the areas where CloudWatch still needs to be used in combination with Prometheus is for managed services such as RDS. The metrics from RDS are directly exported to CloudWatch and from there, you can use a Prometheus exporter to push metrics to Prometheus.
Alerting in Prometheus vs Cloudwatch
Alerting in both technologies can be broadly be considered the same except for one difference i.e., integrating with external tools. While you can always write custom tooling using AWS SQS and CloudWatch, Prometheus comes up with a bunch of built integrations and provides a webhook for easier integration with other systems (details here)
Querying and Dashboarding in Prometheus vs Cloudwatch
Querying and Dashboarding is one area where Prometheus – with Grafana as the dashboarding tool and Prometheus query language wins hands down. With dashboards are that are beautifully backed by a query language that is rich, the dashboarding in Prometheus world is far better. Also CloudWatch does charge for each additional dashboard and in Prometheus setup there is no reason not to create a dashboar if you need to.
The big question: Cost! in Cloudwatch vs Prometheus
One of the final areas that we want to discuss is the cost comparison of using managed CloudWatch vs. managing a Prometheus cluster yourself. The cost here is not just the dollar value paid for infrastructure but also the engineering and skill cost of the engineering bandwidth. There are also other aspects such as cloud lock-in, multi-cloud deployments, hybrid deployments, etc. Let’s first start with pure data-driven costs and then dive into other areas.
Let’s start with some simple assumptions about the usage of a medium-sized organization in one environment over a month’s period of time. We are looking at approximately 100 dashboards and different types of custom metrics used by 100 odd resources causing approximately 1000s of alarms over a month by each major category. Then we also add up 1000 alarms for EC2 instances and 500 alarms each for other services. This gets us to approximately ~2400$ a month, which we have verified and matched with a few customer’s spending ranges about. You can also check the calculation at this link and in the attached screenshot:
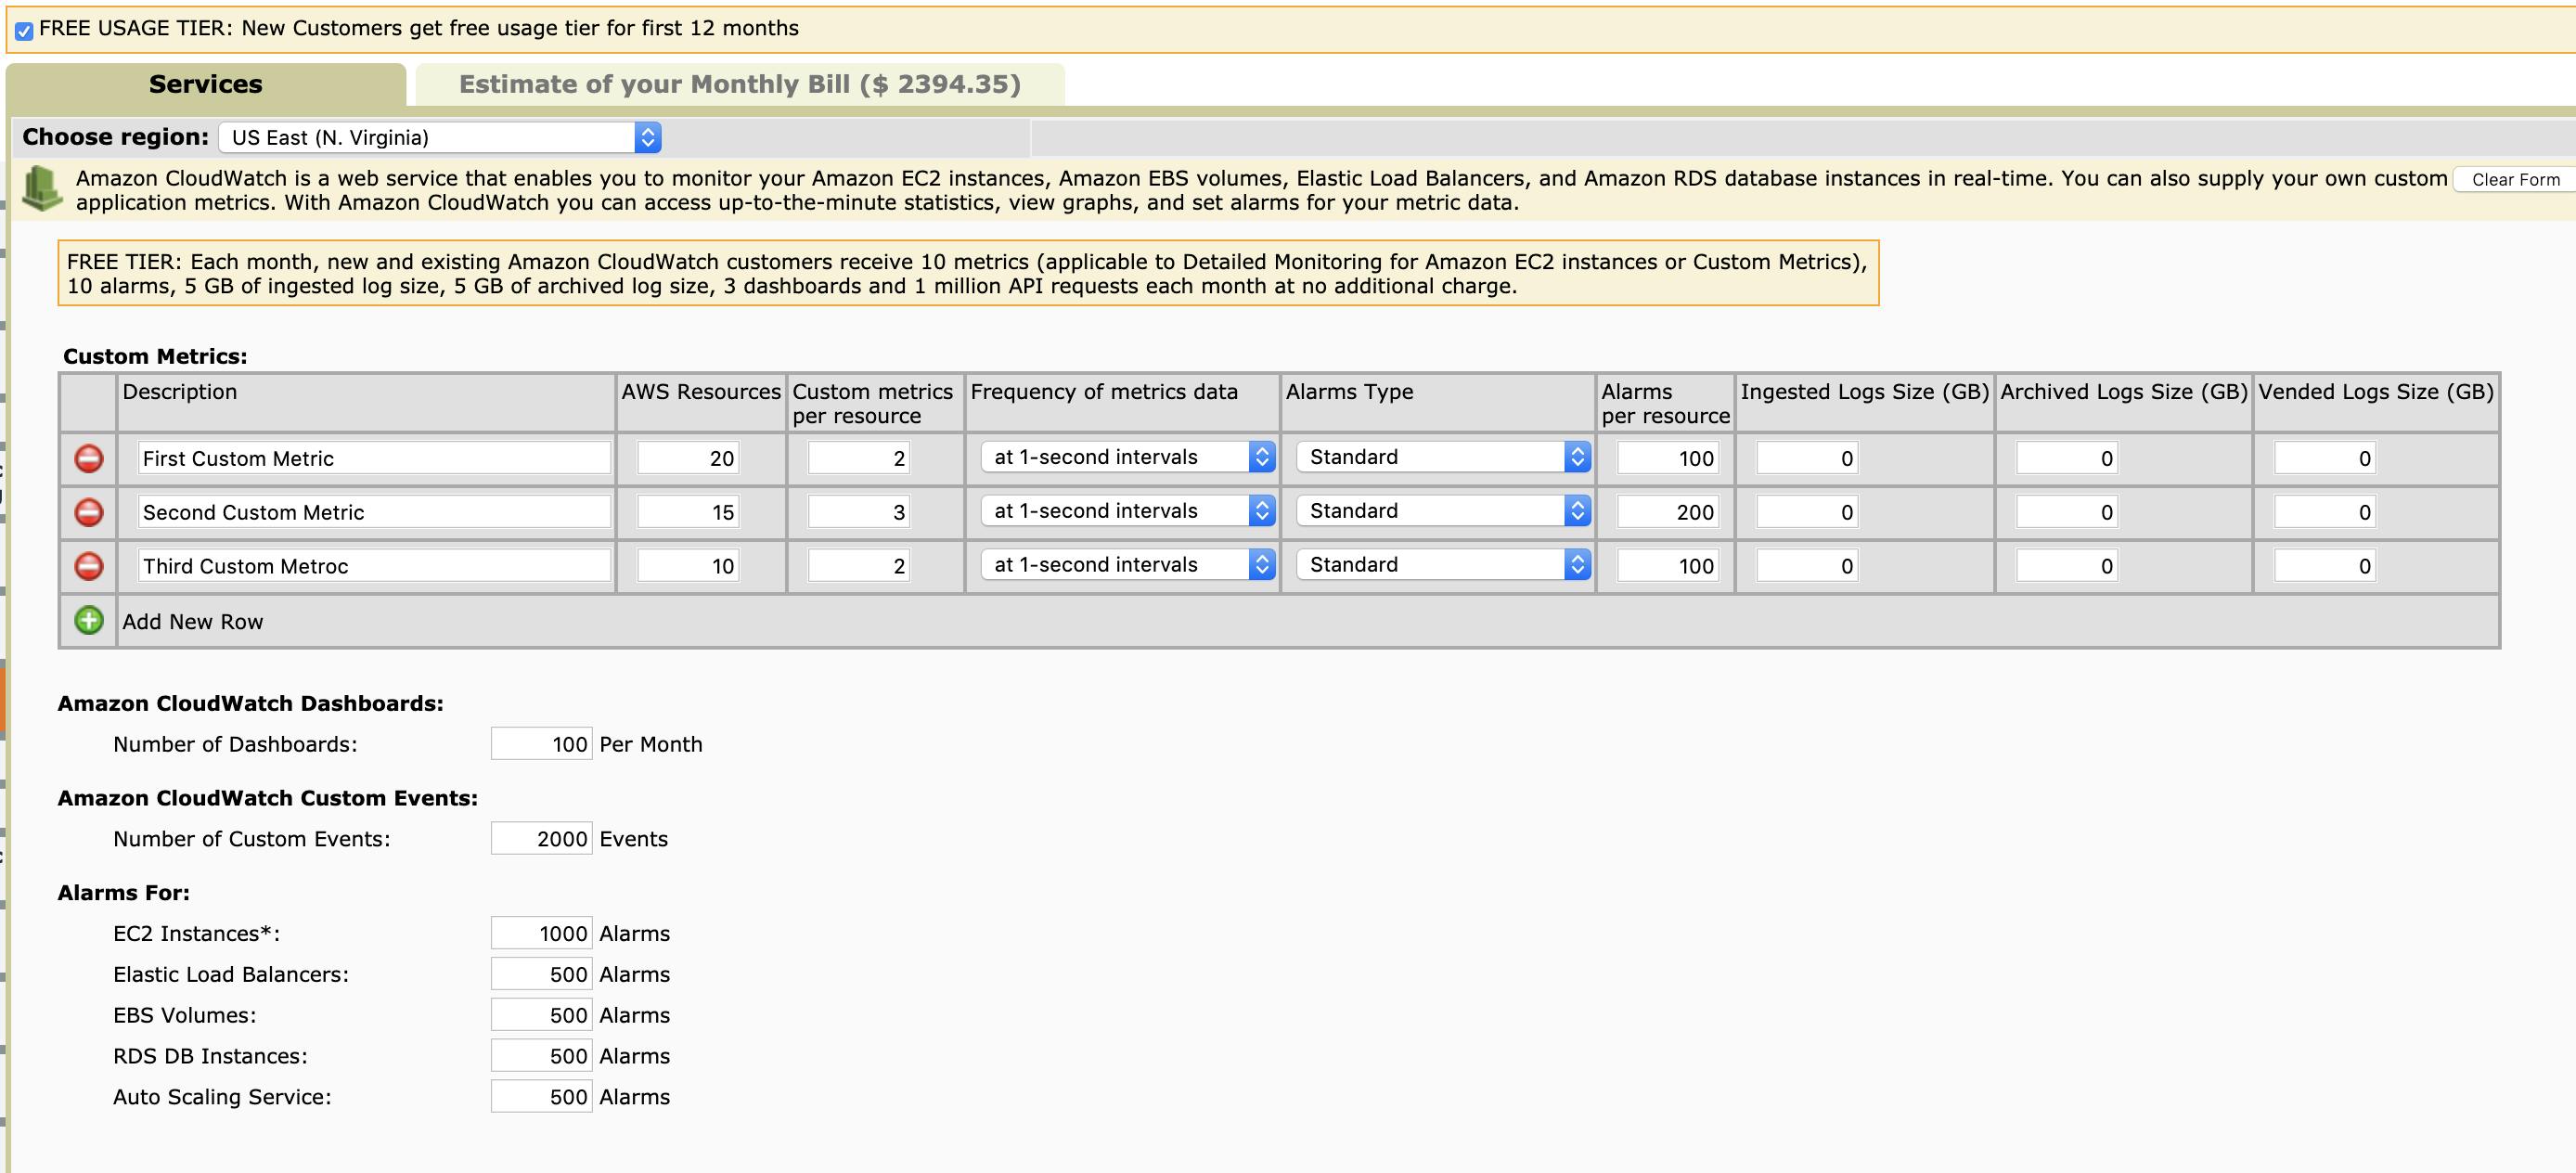
Now to support a similar scale system on Prometheus, there are a few aspects:
- The system has to be HA since we are managing the system on our own (since it is not a managed service)
- We need to account for storage for backup as well beyond current storage. (CloudWatch by default stores metrics for up to 15 days)
- The volume of metric has to be in a range similar to the one used by CloudWatch calculations above – and then determine the cost of infrastructure for that.
Instead of benchmarking from scratch, we will use OpenShift’s benchmarking data published here and use the closest approximation. You can check out the storage calculations suggested by official Prometheus documentation here.
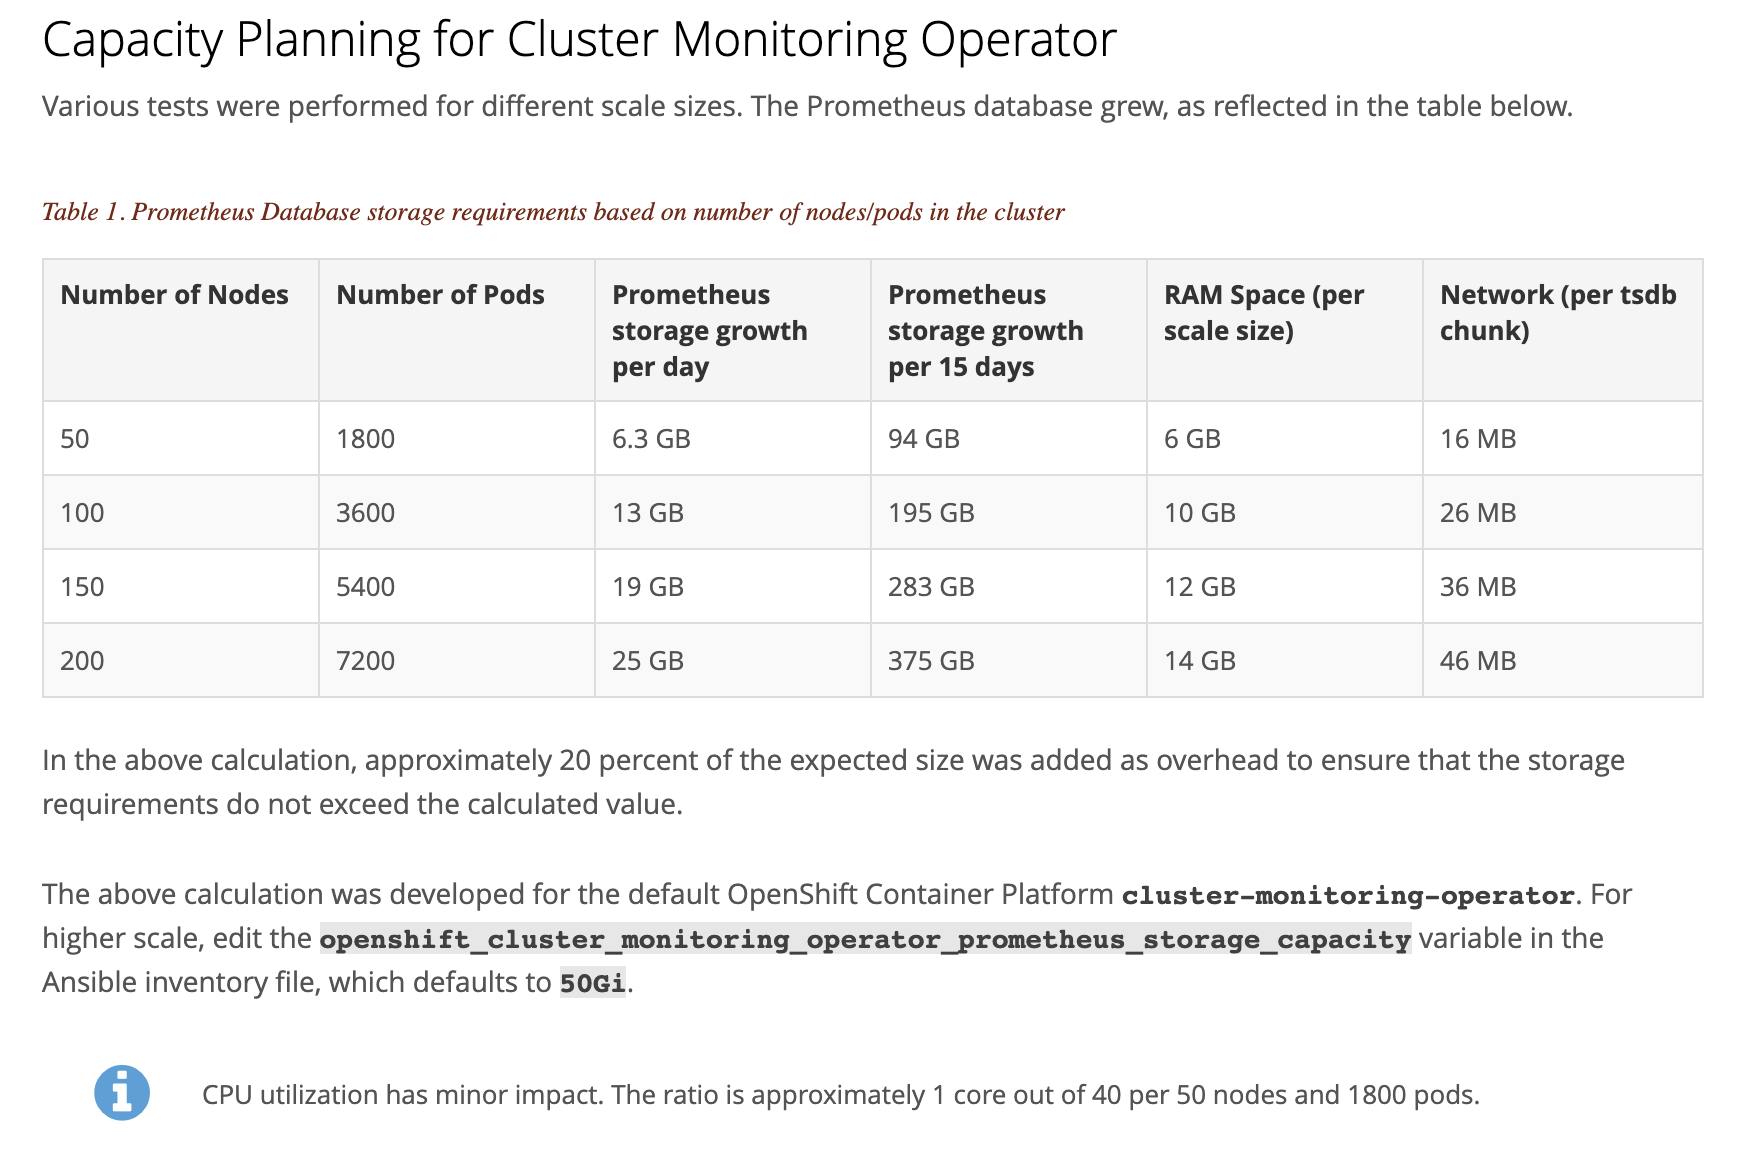
Based on the data above – lets we assume the highest configuration – i.e. 200 node cluster and 7200 pods being monitored and build out Prometheus infrastructure for that. We will build out an HA Prometheus as well as an HA Grafana with up to 2 months of data being stored and a snapshot of 1000GB (i.e. 1 month’s data) being taken. Also, note that this number i.e. 200 nodes and 7200 pods being monitored is far higher than the metrics being used in CloudWatch calculation. The CloudWatch calculation had 105 total custom metrics per second and the total number of custom events has a negligible effect on overall cost. So even with higher data and backup duration, the cost of running Prometheus infrastructure is lesser than a much smaller footprint of CloudWatch:
calculator.s3.amazonaws.com/index.html#r=IAD\&s=EC2\&key=calc-48050612-BE1A-4A6F-8A29-492A9D455C8A
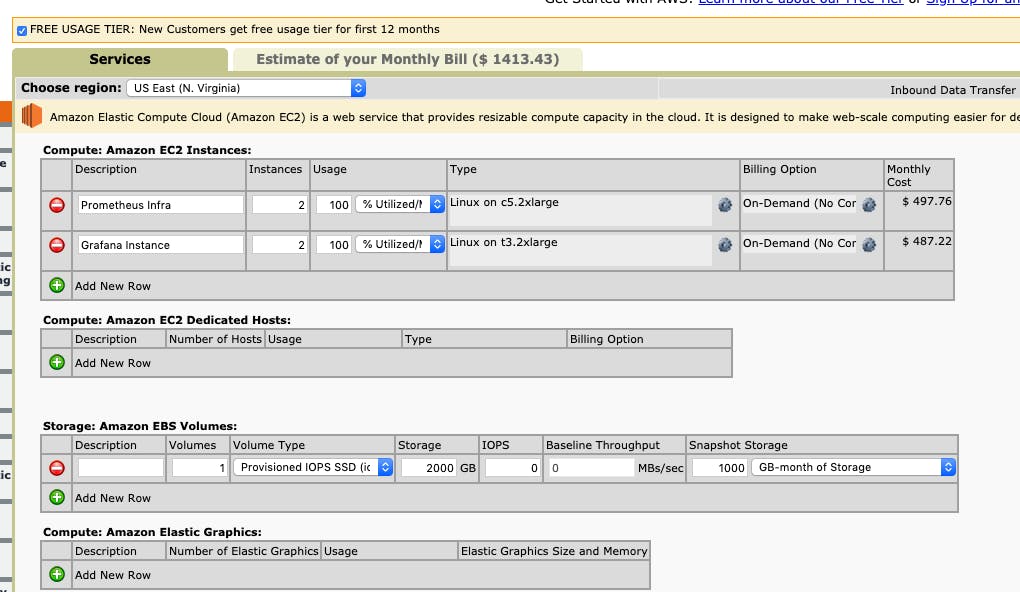
To be fair this is again not a exact apple to apple comparison. The cost of engineering effort and skills to run Prometheus has to be accounted for. Also, the cost of instances considred here is for on demand and might vary for reserverd or spot instances which have lower cost – and that is something we are not taking into account. Overall it is clear from the calculation that the cost of running a Prometheus stack gets cheaper beyond a certain threshold.
Key takeaways - Prometheus Vs CloudWatch
- If you are starting out a new organization or a new product – you definitely might want to use a managed service such as CloudWatch.
- Once you start embracing cloud-native technologies and also thinking of multi-cloud or cloud agnostic infrastructure then it is better to start thinking about Prometheus.
- If you are doing anything of non-trivial scale – there might be benefits to using Prometheus. The benefits can be economic as well as beyond economics such as feature richness.
- For some AWS managed services such as RDS – you will need to use CloudWatch for native monitoring and then use Prometheus exporters to get the data into Prometheus servers.
We would love to hear the stories of using CloudWatch vs Prometheus or other services and how did you make the decision of choosing one over the other. Let's start a conversation on Twitter
Related Articles:
You might be also interested in posts related to Prometheus implementation: