


This weekend was all about fixing a performance bug on Avo.
Background
Avo does a lot of meta-programming and its goal is to be as extendable as possible in the most uniform way. Because of that, we use a lot of partials in our rendered pages, keeping things DRY and extendable.
Let's have a look at the Index view for User (/avo/resource/users). The structure looks a bit like this:
- app/views/avo/base/index.html.erb
  - app/components/resource_index_component.html.erb
    - app/components/resource_table_component.html.erb
      - app/components/resource_table_row_component.html.erb x 72 (Number of records)
        - app/views/avo/item_selector_controller_init.html.erb x 72 (Number of records)
        - app/views/avo/item_selector_controller_input.html.erb x 72 (Number of records)
        - app/components/resource_controls_component.html.erb x 72 (Number of records)
        - app/components/index/field_wrapper_component.html.erb x 18 (Number of fields)
          - app/views/avo/components/index/EACH_FIELD_COMPONENT.html.erb x 18 (Number of fields)
            - sometimes the field components contain other partials like common views and svgs
So we quickly get to 3000+ partials for a 72 row table, not counting other partials on the rest of the page.
The bug
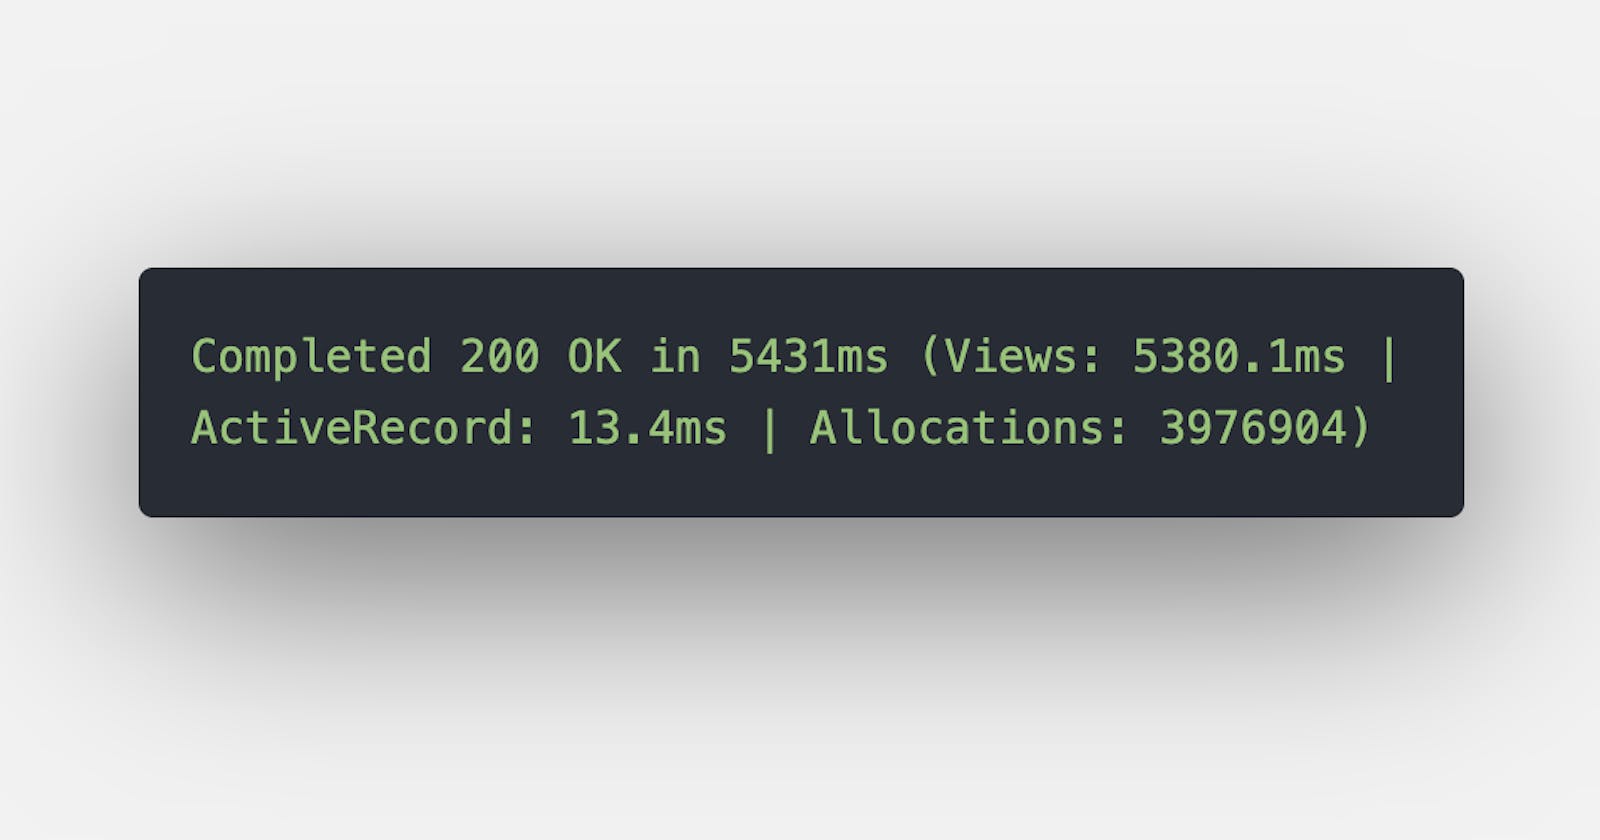
I noticed that rendering the whole page took somewhere from 5.5 seconds to sometimes 7 seconds.
Completed 200 OK in 5431ms (Views: 5380.1ms | ActiveRecord: 13.4ms | Allocations: 3976904)
I mean... I knew that Rails sometimes has performance issues with rendering a lot of partials, but still... 7 seconds is a long time.
I said, OK. I'll just cache the whole row and be done with it. But still, when someone accesses that page for the first time it will seem like an eternity. I can't have that. Avo is about having the best user experience (alongside the best API for developers). I gotta dig down and figure out the problem.
The troubleshoot
Fields from partials to view components
I started converting the field partials to view_components. They claim 10x performance over partials. I can confirm some of those performance improvements. Besides that you get a nice contained API to work with views and a nice way to test them.
So I started with the big culprit _index_field_wrapper.html.erb that sets up the field.value inside the td.
<td class="px-4 py-2 leading-tight whitespace-no-wrap h-12 <%= classes %>" data-field-id="<%= field.id %>">
  <% if field.value.blank? and dash_if_blank %>
    —
  <% else %>
    <%= yield %>
  <% end %>
</td>
Then I converted all the other fields to view components. That brought down the render from 5.5 to 4.5 seconds.
Completed 200 OK in 4483ms (Views: 4419.6ms | ActiveRecord: 16.4ms | Allocations: 3365454)
Remove extra partials we can extract to helper functions
The row/grid_item selector has two partials we inject into the page. One for the stimulus controller init and one for each row/grid_item so the user can select the records on the page.
I extracted them into two helper methods. That clears out one partial/record and one more for the whole page.
# before
<%= render partial: 'avo/partials/item_selector_controller_init', locals: { resource: @resource } %>

# after
<%== item_selector_init @resource %>
Page renders in about 4.2 seconds. A bit better, but we need more!
Completed 200 OK in 4219ms (Views: 4165.9ms | ActiveRecord: 15.7ms | Allocations: 3429476)
Go nuclear and remove all things
I needed a better strategy, so I went nuclear. I removed all the fields from the user resource. I left only the id field.
Completed 200 OK in 1872ms (Views: 1825.0ms | ActiveRecord: 9.6ms | Allocations: 1483311)
1.8 seconds. Better, but I still don't know what causes it.
Let's remove the resource controls component (view, edit, delete buttons at the end of the row).
Completed 200 OK in 275ms (Views: 242.6ms | ActiveRecord: 4.5ms | Allocations: 222647)
0.3 seconds. Hmm. I might have hit something.
I brought back the resource controls component and tried to figure out what causes that slowdown. That component has only a handful of methods, nothing heavy. It must be something else. The template uses those methods and renders a couple of links and a couple of forms with some inlined svgs.
🤔 "inlined svgs". Could this be it?
To inline the svg's I'm using inline_svg_pack_tag from the wonderful inline_svg gem.
So I pull out the rack-mini-profiler gem and hit that page with the ?pp=flamegraph param. After a deep dive I see a lot of Webpacker::DevServerProxy#perform_request calls.
🔥 Eureka! 🔥
I'm using the bin/webpacker-dev-server server which holds the assets in memory and refreshes them on change. So when the app needs an asset (like an svg) it requests it from that server. Makes sense!
I enabled the resource controls component and went into my svg helper and instead of returning inline_svg_pack_tag I just prepended a line return 1. I want to see if this is the culprit.
Completed 200 OK in 343ms (Views: 307.6ms | ActiveRecord: 5.7ms | Allocations: 279857)
Boom! 🔥 0.3 seconds. Amazing!
Disable the dev-server
I went and disabled the webpack-dev-server and compiled the assets using bin/webpack. I want to see the impact.
Completed 200 OK in 1949ms (Views: 1885.6ms | ActiveRecord: 30.7ms | Allocations: 1879615)
Hmm 🤔. Not that much of a difference. Kinda the same result with the dev server on. But I noticed something else.
300+ of these 👇
...
[Webpacker] Everything's up-to-date. Nothing to do
[Webpacker] Everything's up-to-date. Nothing to do
[Webpacker] Everything's up-to-date. Nothing to do
[Webpacker] Everything's up-to-date. Nothing to do
[Webpacker] Everything's up-to-date. Nothing to do
[Webpacker] Everything's up-to-date. Nothing to do
[Webpacker] Everything's up-to-date. Nothing to do
  Rendered /Users/adrian/work/avocado/gem/avo/app/views/avo/partials/_paginator.html.erb (Duration: 1.0ms | Allocations: 854)
  Rendered /Users/adrian/work/avocado/gem/avo/app/views/avo/base/index.html.erb within layouts/avo/application (Duration: 1861.0ms | Allocations: 1829914)
A lot of [Webpacker] Everything's up-to-date. Nothing to do log entries. It seems that webpacker checks to see if the assets are compiled on each asset request and that slows it down a lot. Seems a bit wasteful to me, but I haven't checked the internals.
I decided to monkey patch this myself by using my own svg inline solution.
The fix
This new helper should:
- check if the file exists
- read it from the disk
- add extra classes and options
- cache it
- render it in place.
I ended up with this tiny thing.
def svg(file_name, **args)
  options = {}
  options[:class]  = args[:class].present? ? args[:class] : 'h-4 mr-1'
  options[:class] += args[:extra_class].present? ? " #{args[:extra_class]}" : ''

  # Create the path to the svgs directory
  file_path = "#{Avo::Engine.root}/app/frontend/svgs/#{file_name}"
  file_path = "#{file_path}.svg" unless file_path.end_with? '.svg'

  # Create a cache hash
  hash = Digest::MD5.hexdigest "#{file_path.underscore}_#{options.to_s}"

  svg_content = Avo::App.cache_store.fetch "svg_file_#{hash}", expires_in: 1.year, cache_nils: false do
    if File.exists?(file_path)
      file = File.read(file_path)

      # parse svg
      doc = Nokogiri::HTML::DocumentFragment.parse file
      svg = doc.at_css 'svg'

      # attach options
      options.each do |attr, value|
        svg[attr.to_s] = value
      end

      # cast to html
      doc.to_html.html_safe
    else
      nil
    end
  end

  return '(not found)' if svg_content.to_s.blank?

  svg_content
end
I refresh the page and voila.
Completed 200 OK in 248ms (Views: 230.9ms | ActiveRecord: 3.4ms | Allocations: 303919)
Add the fields back.
Completed 200 OK in 482ms (Views: 458.7ms | ActiveRecord: 6.7ms | Allocations: 425416)
The same page with 72 records loads in 0.5 seconds rather than 5-7 seconds. More than 10x improvement by figuring out that nasty webpacker performance issue.
It was a tough frustrating weekend but I'm very happy to have figured that out. Now I'm one step closer to releasing the Hotwire beta 🎉