Support Vector Machine and Kernel Trick


 One of the methods we use to separate the data set in the vector space is the Support Vector Machine (SVM) algorithm. With this method, it is aimed to determine the boundary line that separates data sets in space.There are various types such as linear, polynomial, sigmoid and rbf. We will go over it shortly. In our example, we will use the 2016 THE (Times Higher Education) World University Rankings dataset. The file is attached below. Before we finish our topic, let's take a look at the descriptions:
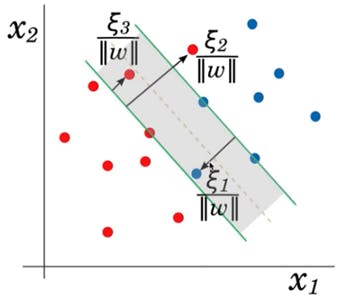
Linear: A linear boundary is drawn between the two data sets. Polynomial: Multiple variable decision boundary. Sigmoid: The fairly famous 'S' function is drawn. RBF: Radial program is drawn with the method we call 'core cheating'. What does it mean?
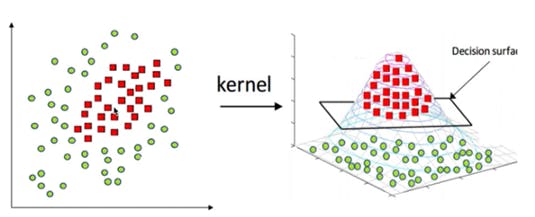
Our data sets are not always separated by linear method. With this algorithm, we can easily separate. Let's take those who are curious about the details to the attached cards! Before moving on to our codes, let's take a look at our data:
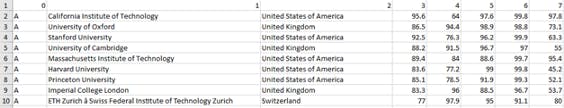
With 7 columns, we have 800 universities in our rows, in our first column I added A-B-C-D classification in every 200 rows. I thought of using this in the prediction algorithm; It will learn the data in columns 3–7 and predict its place in 4 stages. We will observe the results of the algorithms described above altogether.
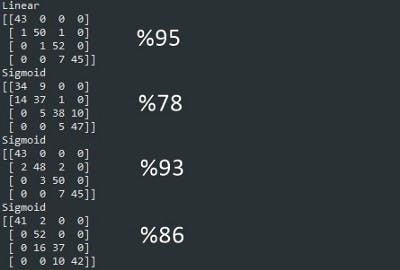
Our linear function gives a better result. This is a good thing! It can characterize those classified incorrectly as false, and those classified correctly as true.