Post hidden from Hashnode
Posts can be hidden from Hashnode network for various reasons. Contact the moderators for more details.
The Journey
HOW IT IS GOING


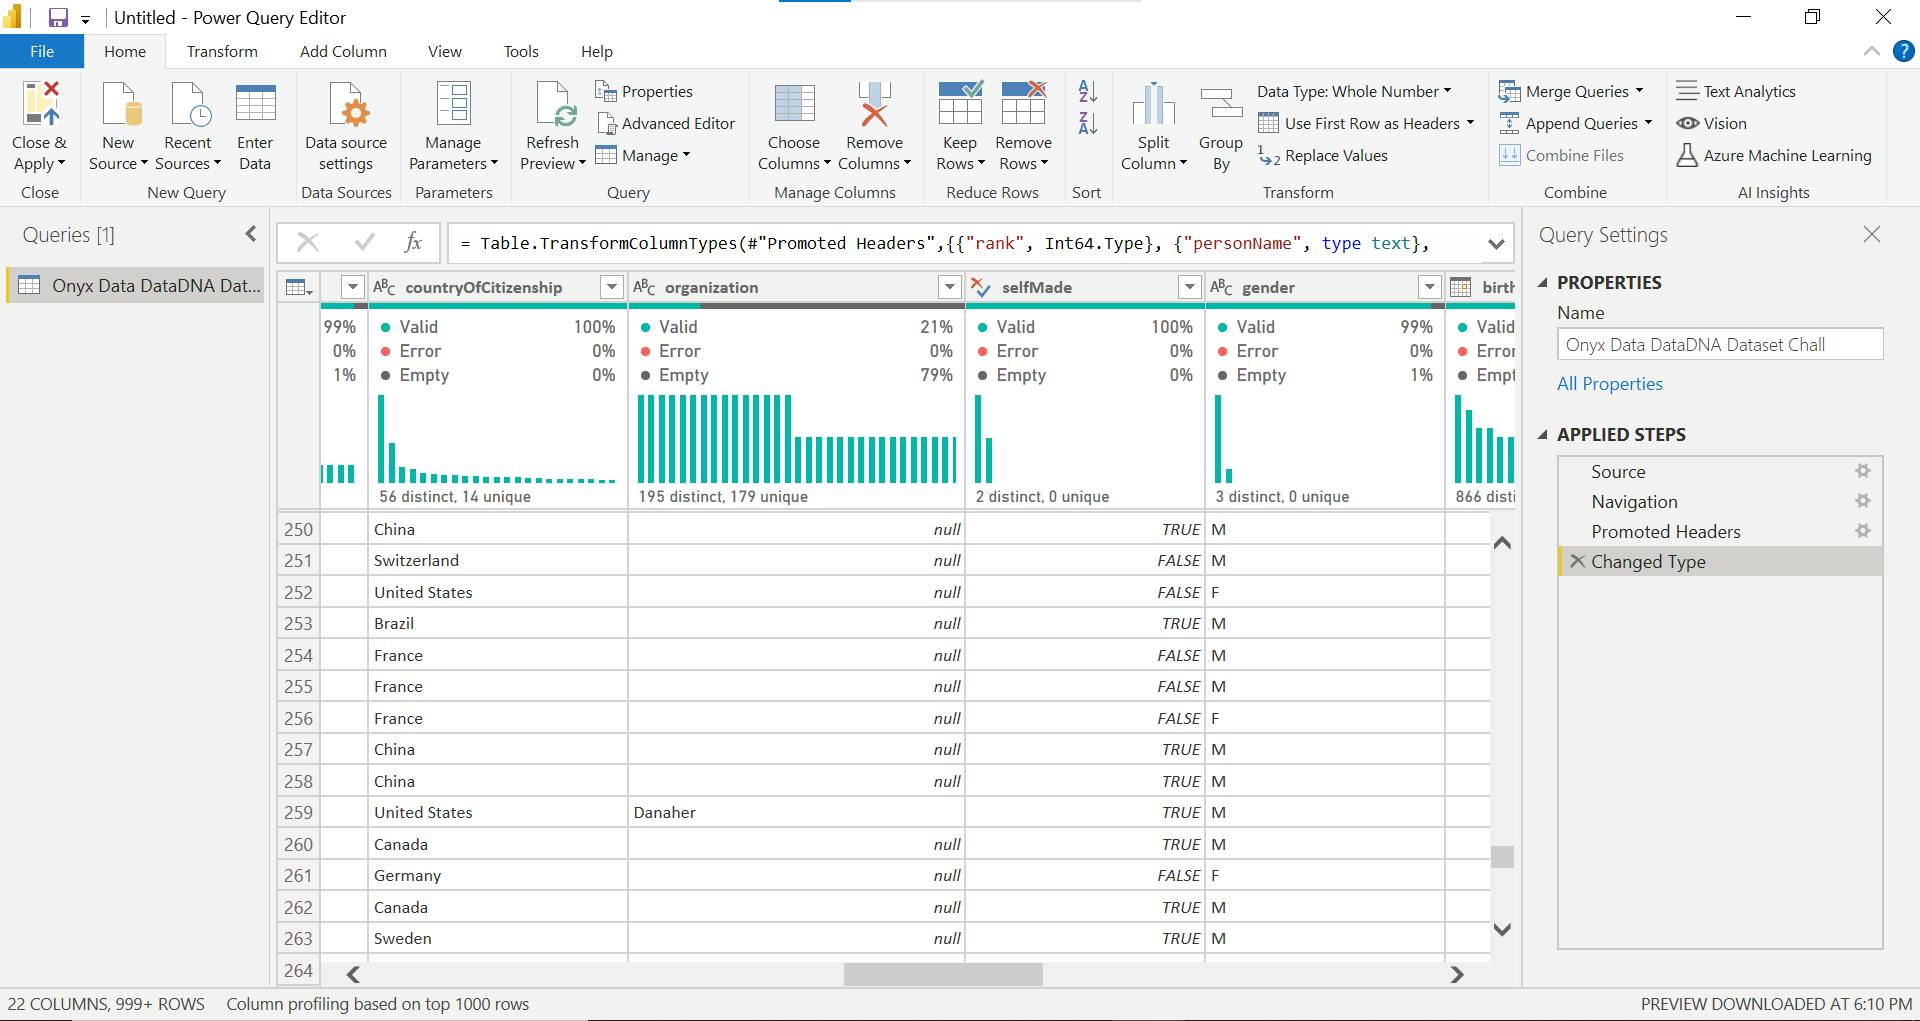
I remembered the last time I was talking about the start of my journey, so i am still in the journey. This week I tried to get my hands on datasets for practice when I came across the onyx data challenge. This month they are analyzing the Forbes billionaire data, the goal is to get the month philanthropic and the industry that drives the most billionaires. DATA STRUCTURES The data was gotten from Kaggle with the help of onyx data. It is a CSV file which includes list of various billionaires which includes their final worth ,bio ,and the organization. DATA PROCESSING
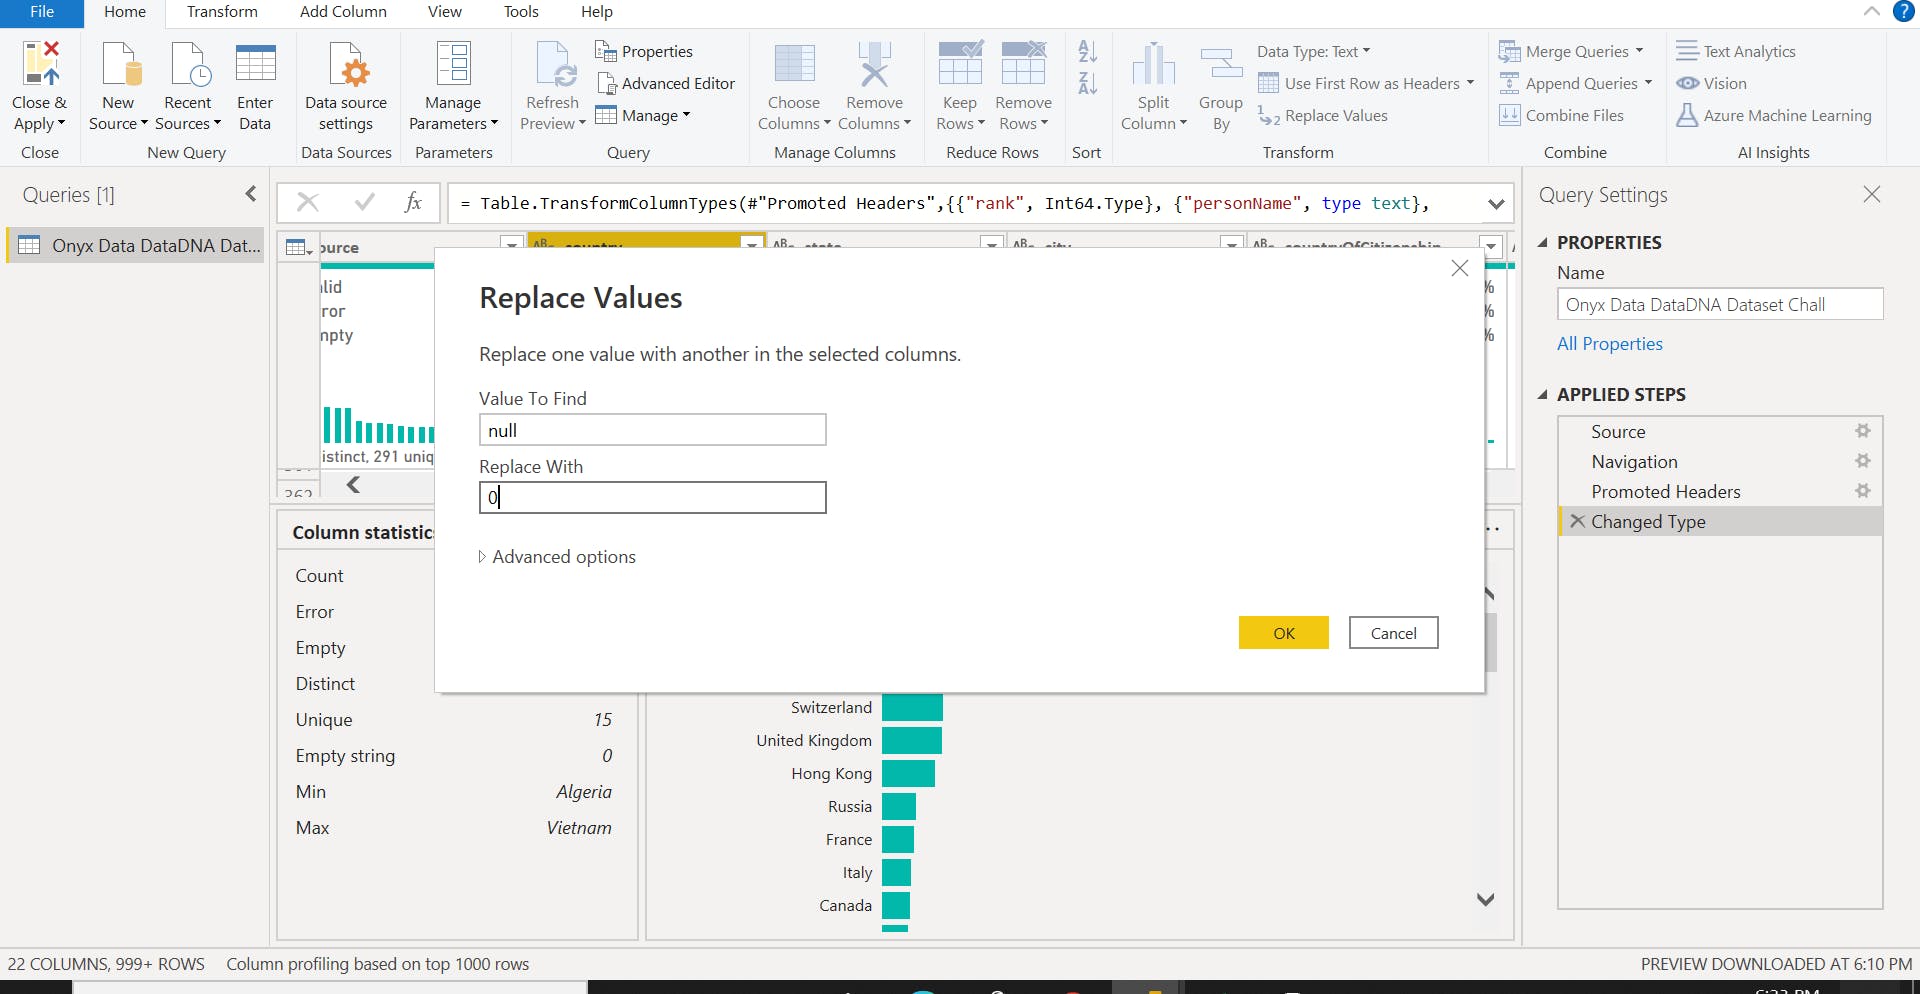
- Firstly Imported the data into Power BI with the get data tool which I then transformed using power query. I removed the duplicate data and also set the data in their proper format.
 ANALYSING THE DATA
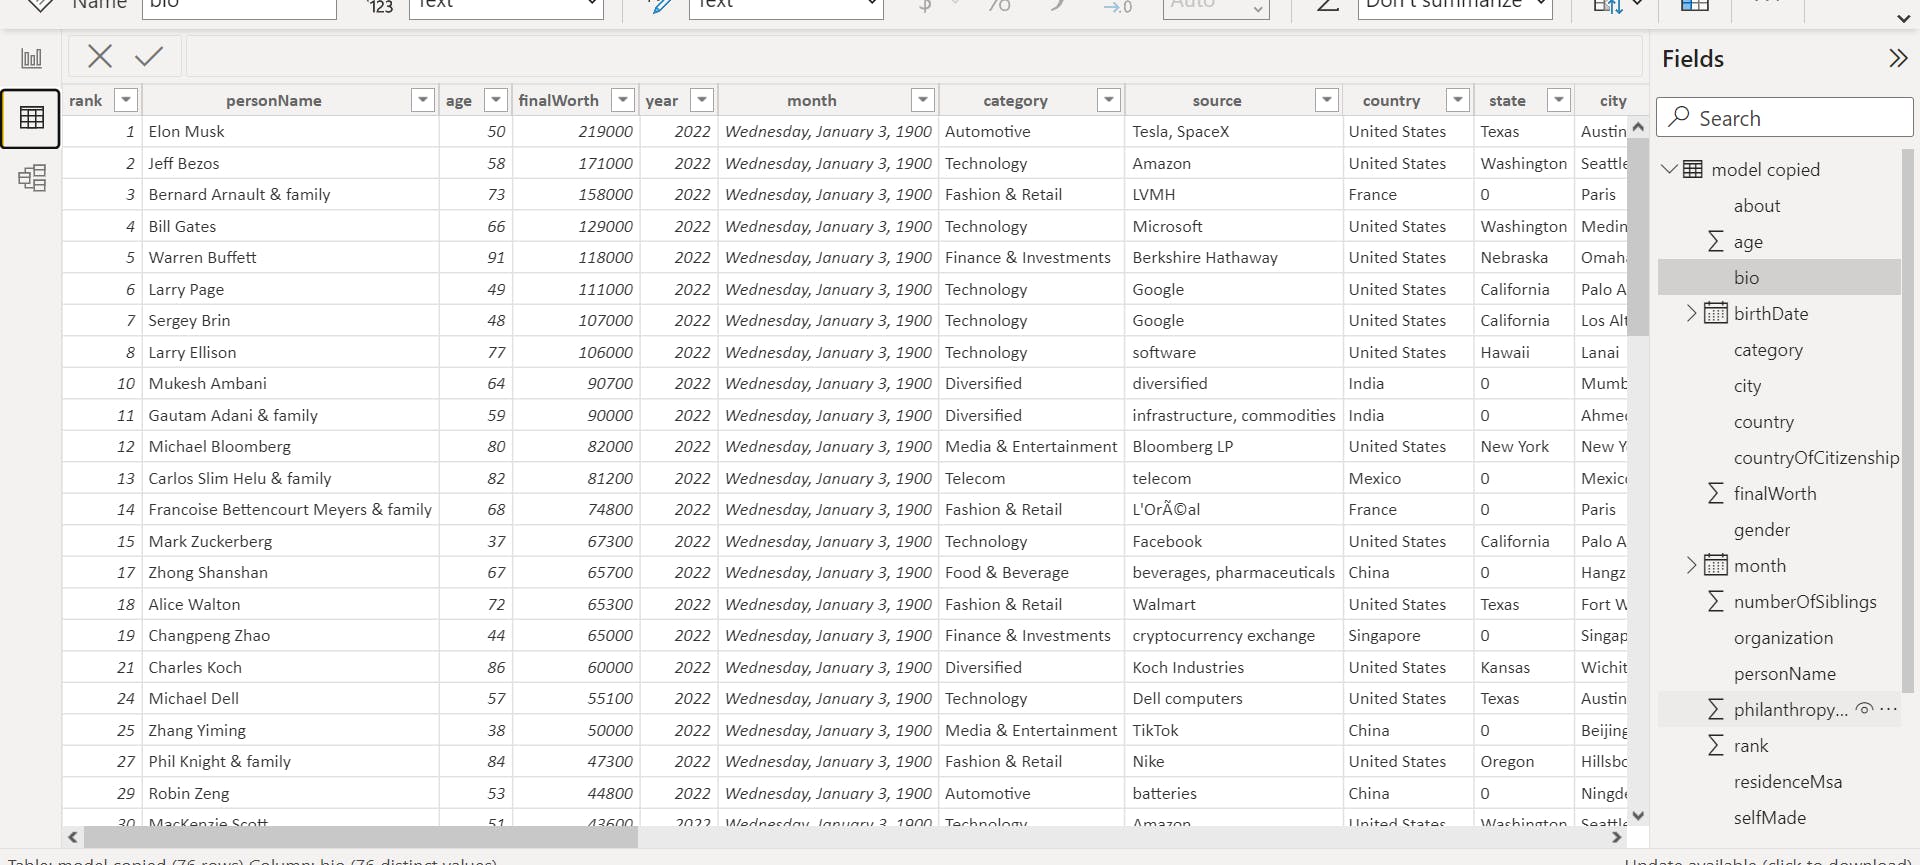
The cleaned data was the loaded into power bi desktop.
ANALYSING THE DATA
The cleaned data was the loaded into power bi desktop.
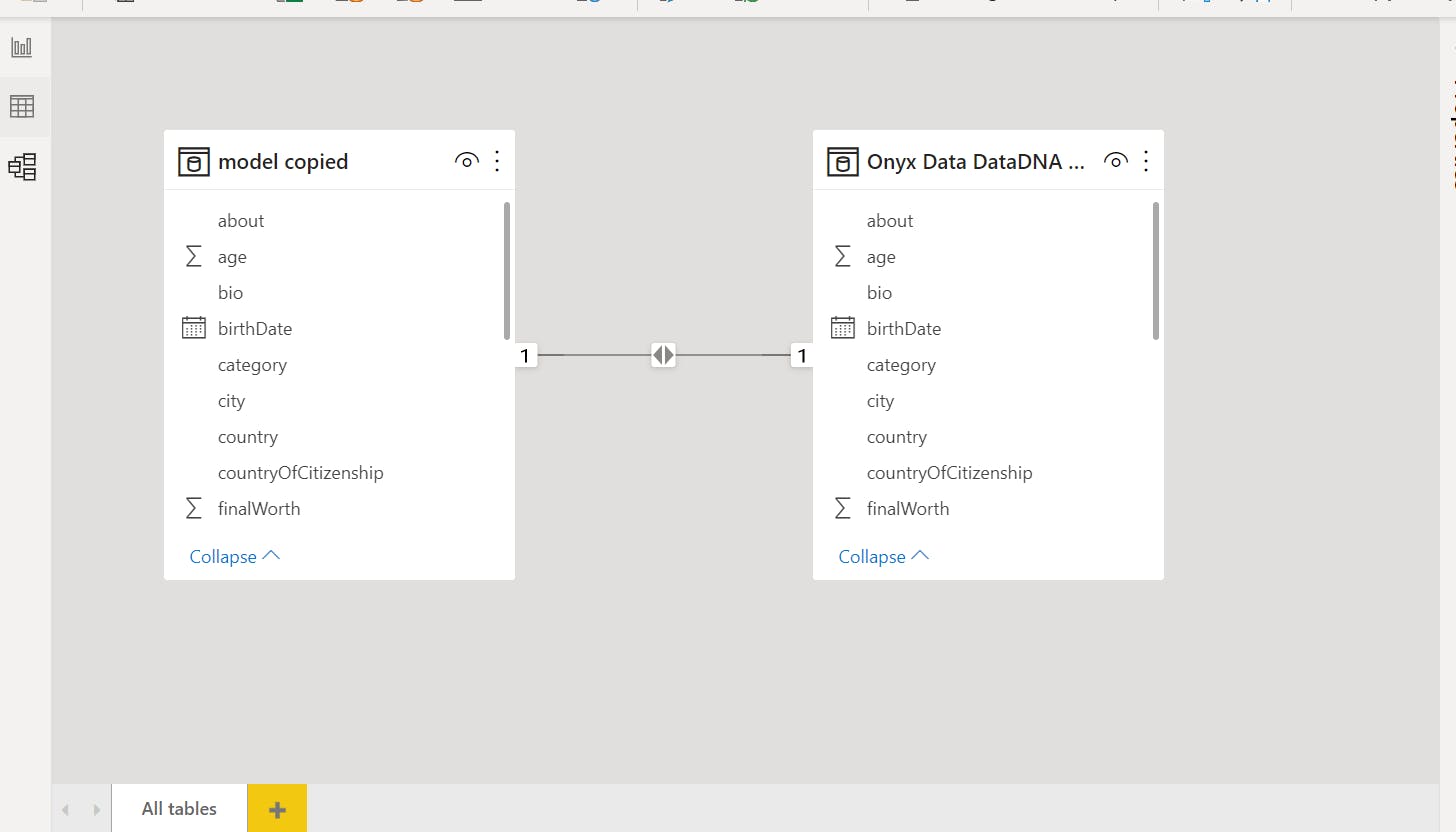
After which a model was created to help in proper visualization of data
DASHBOARDING Finally the dashboard was created using a stacked column bar chart, with navy and white,
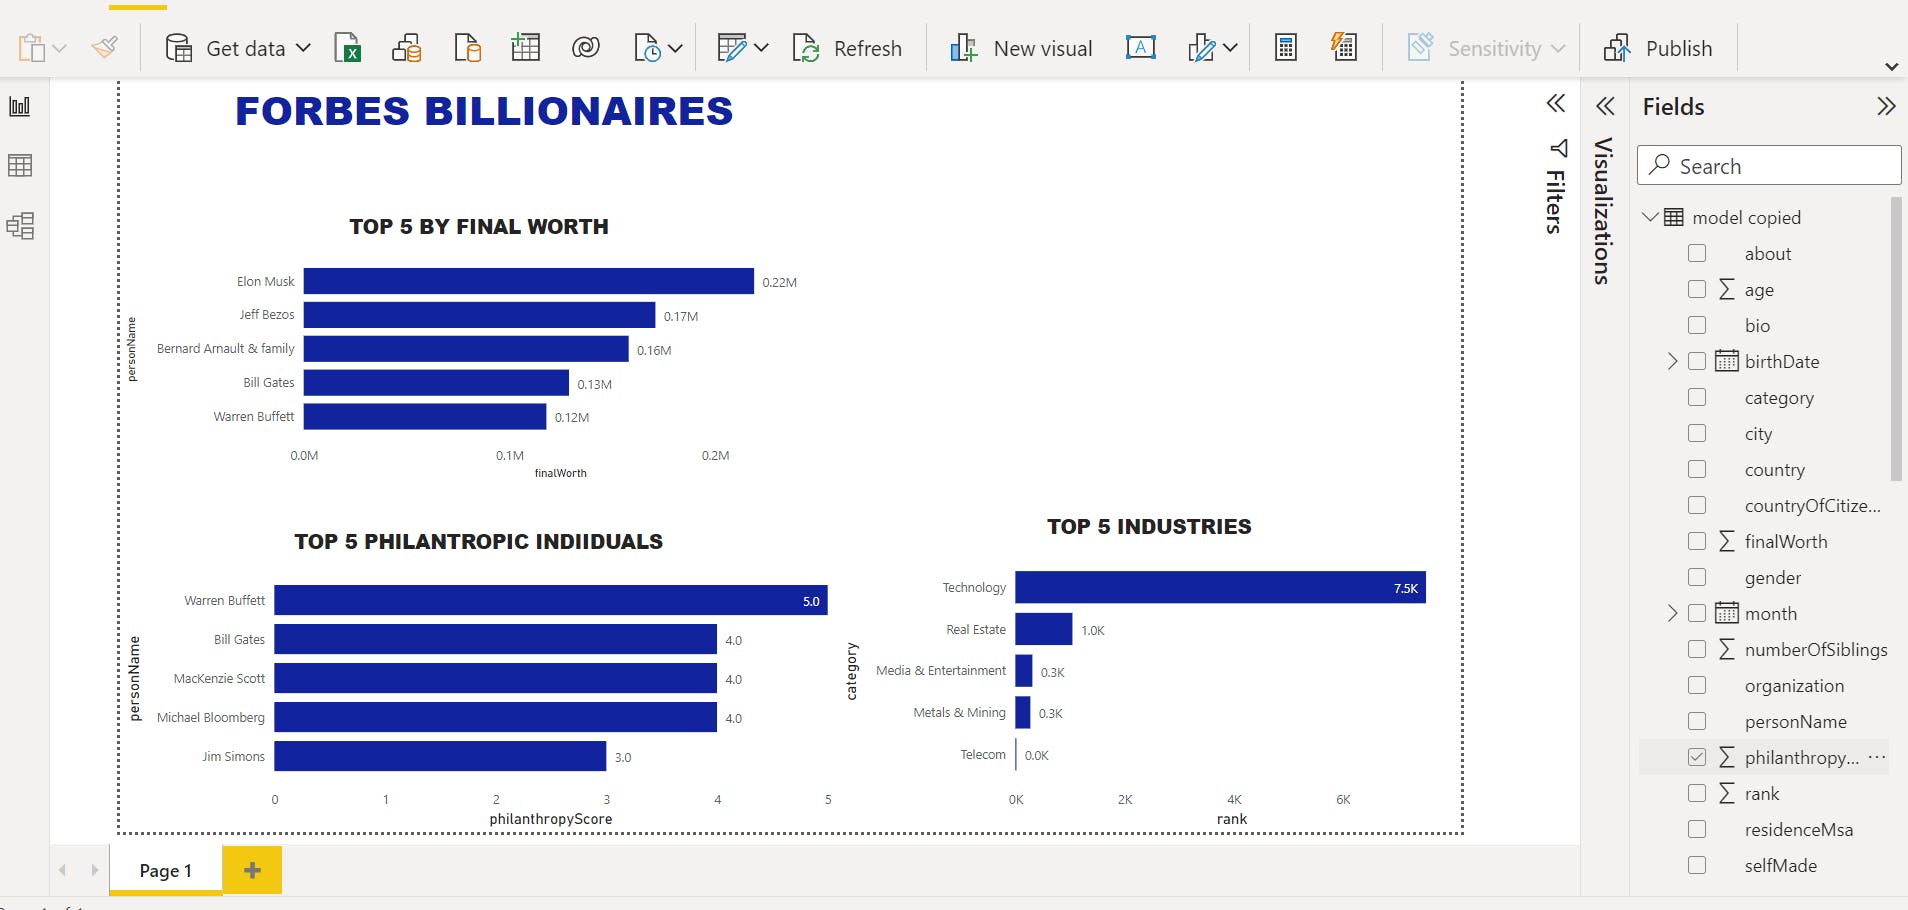
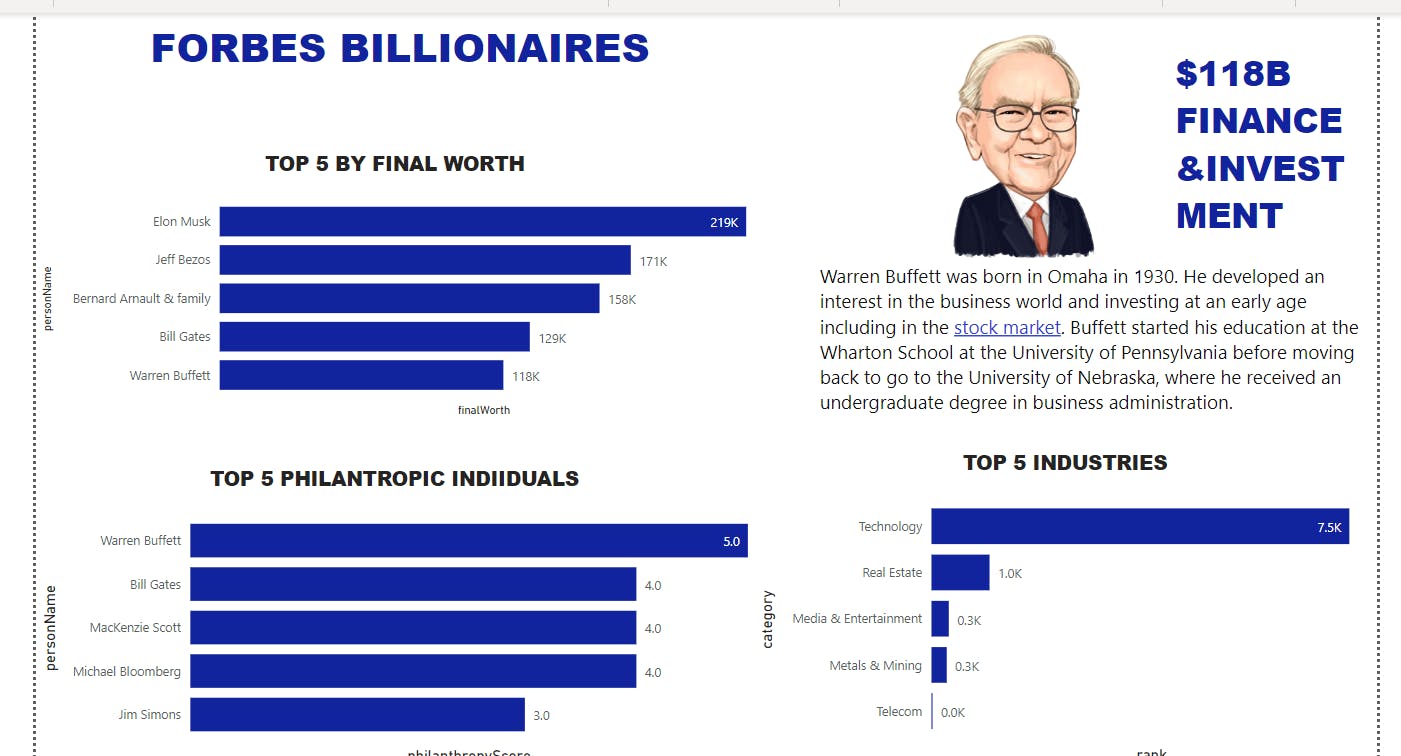
From the dashboard it can be seen that Warren Buffet is the most philanthropic billionaire with a final worth of $118B and the Technology industry drives the most billionaires.
Thankyou for reading, till next time.