


Prometheus has become the default monitoring applications and systems in a cloud-native world. For any real-world use case, Prometheus should be highly available – which has it’s set of challenges. Once you run Prometheus in HA mode there are a bunch of issues such as data duplication, achieving single pane of glass for duplicate data, etc. To solve this problem – Cortex was born. In this blog, we will look at how to use Cortex for HA monitoring with Prometheus. Let's begin!
What is Cortex?
Cortex is a CNCF sandbox project that seeks to provide long term storage and a global metrics view for metrics scraped using Prometheus.
Let’s first look at the main goals of Cortex and then some of the problems it solves for Prometheus:
- Horizontal Scalability – Cortex can be split into multiple microservices, each of which can be horizontally scaled independently. For example, if a lot of Prometheus instances are sending data to Cortex, you can scale up the Ingester microservice. If there are a lot of queries to cortex, you can scale up the Querier or Query Frontend microservices.
- High Availability – Cortex can replicate data between instances. This prevents data loss and avoids gaps in metric data even with machine failures and/or pod evictions.
- Multi-Tenancy – Multiple untrusted parties can share the same cluster. Cortex provides isolation of data throughout the entire lifecycle, from ingestion to querying. This is really useful for a large organization storing data for multiple units or applications or for someone running a SaaS service.
- Long term storage – Cortex stores data in chunks and generates an index for them. Cortex can be configured to store this in either self-hosted or cloud provider backed databases or object storage.
Why do we need Cortex?
How to make Prometheus High availability for monitoring & avoid Data De-duplication?
Prometheus doesn’t have high availability by default. A way to make Prometheus highly available is to run multiple instances scraping the same jobs. These instances will have slight variances in data due to minor time interval differences when scraping metrics. Furthermore, if one of the instances goes down for a couple of hours, there will be gaps in data when queries get forwarded to that instance. If we use a tool like grafana to visualize the metrics as graphs, we may get different sample values or have gaps in the graphs.
Cortex can be configured to read data from multiple HA Prometheus instances. It accepts metrics from one main instance and discards the metrics from other instances. In case one replica goes down Cortex switches seamlessly to another replica and marks it as the main. To do this, Cortex looks at two labels, a common one to associate with a cluster(or a group of Prometheus) and the other to identify replicas.
Global metrics view
Prometheus instances can be configured to perform a remote write to cortex. Using this, metrics are aggregated from multiple clusters into one cluster running cortex. This provides us with a central location where we can observe the metrics of our entire infrastructure. Cortex provides a Prometheus/PromQL compatible endpoint. Services like Grafana can add this endpoint as a Prometheus data source and perform queries in the same way as a normal Prometheus instance.
Long term storage
Prometheus’s local storage is not meant as durable long term storage. Metrics sent to the cortex are stored in the configured storage service. In case of cloud-provided storages, this frees you from the hassle of running your own DB. This also lets you take advantage of the provided SLAs. As of 25th June, the following options are available:
Index (and Chunk) Storage:
- Amazon Dynamodb
- Google Bigtable
- Apache Cassandra
Optionally, Cortex also supports Object Stores for storing chunks:
- GCS
- S3
Multi tenancy
The multi-tenancy is provided by setting an http header (X-Scope-OrgID) when writing metrics to the cortex. The same header value has to be provided when querying. In the example below, this header is set using an nginx reverse proxy.
Architecture diagram
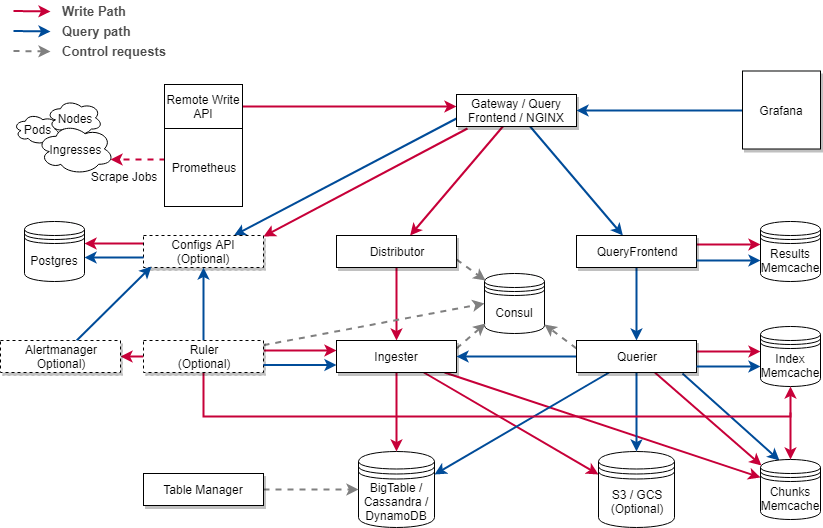
Cortex Architecture (Source)
- Nginx/gateway – A reverse proxy that sits in front of cortex and forwards any received requests to the respective service.
- Distributor – Handles incoming metrics, splits them into batches and passes them to ingesters. If the replication factor is set to >1, the data is sent to multiple ingesters.
- Ingester – This service is responsible for writing data to the configured storage backends. Ingesters are semi-stateful as they retain the last 12 hours of samples. These samples are batched and compressed before being written to the chunk store.
- Query Frontend – An optional component that queues query requests and retries them in case of failures. Results are also cached to improve performance
- Querier – The Querier handles the evaluation of the PromQL queries. Samples are fetched the chunk storage and/or the ingesters in case of recent data
Other components:
- Ruler – Handles alerts produced by alertmanager
- Alertmanager – Evaluates alert rules
- ConfigsAPI – Stores configs for ruler and alertmanager in Postgres
- Table Manager – Responsible for creating tables in the selected chunk/index storage backends
- Consul – Stores a consistent hash ring generated by the distributor. The hashed values are used by the distributor to select ingesters when sending metrics.
Thanos vs Cortex - differences and similarities
Thanos
Thanos and Cortex have very similar goals: to aggregate metrics, store them in block storage and have a single pane of glass for all your metrics. Thus, it’s no surprise that both projects reuse a lot of Prometheus code. However, there are a few key differences that may help you decide to use one of them over the other
| Thanos | Cortex |
|---|---|
| Recent data is stored in Prometheus | Recent data is stored in Injesters (A Cortex Component) |
| Uses a Sidecar that writes data to block storage | Uses Prometheus remote write to send data to cortex |
| Single-tenant | Multi-tenant |
| Manual sharding | Automatic Sharding of data based on labels |
| Prom TSDB blocks | Indexed chunks |
| Downsampling: Historical data can be summarised
(eg. 5 sec samples averaged out to a 1 min sample) |
query sharding (A 30 day is converted into 30 one day query) |
| Requires Ingress to cluster in which Prometheus is running, for querying | Only Egress is required from cluster running Prometheus |
Let's do a Cortex walkthrough
Let’s try out Cortex with a real example by installing it and configuring it with multiple Prometheus and Grafana to visualize the data. Clone the GitHub repo containing the necessary files.
git clone github.com/kanuahs/cortex-demo.git
cd cortex-demo
Prometheus and Cortex with Docker Compose
For a simple setup we’ll start the following services using docker-compose:
- Three Prometheus containers
- Consul
- Three Cortex containers
- Grafana
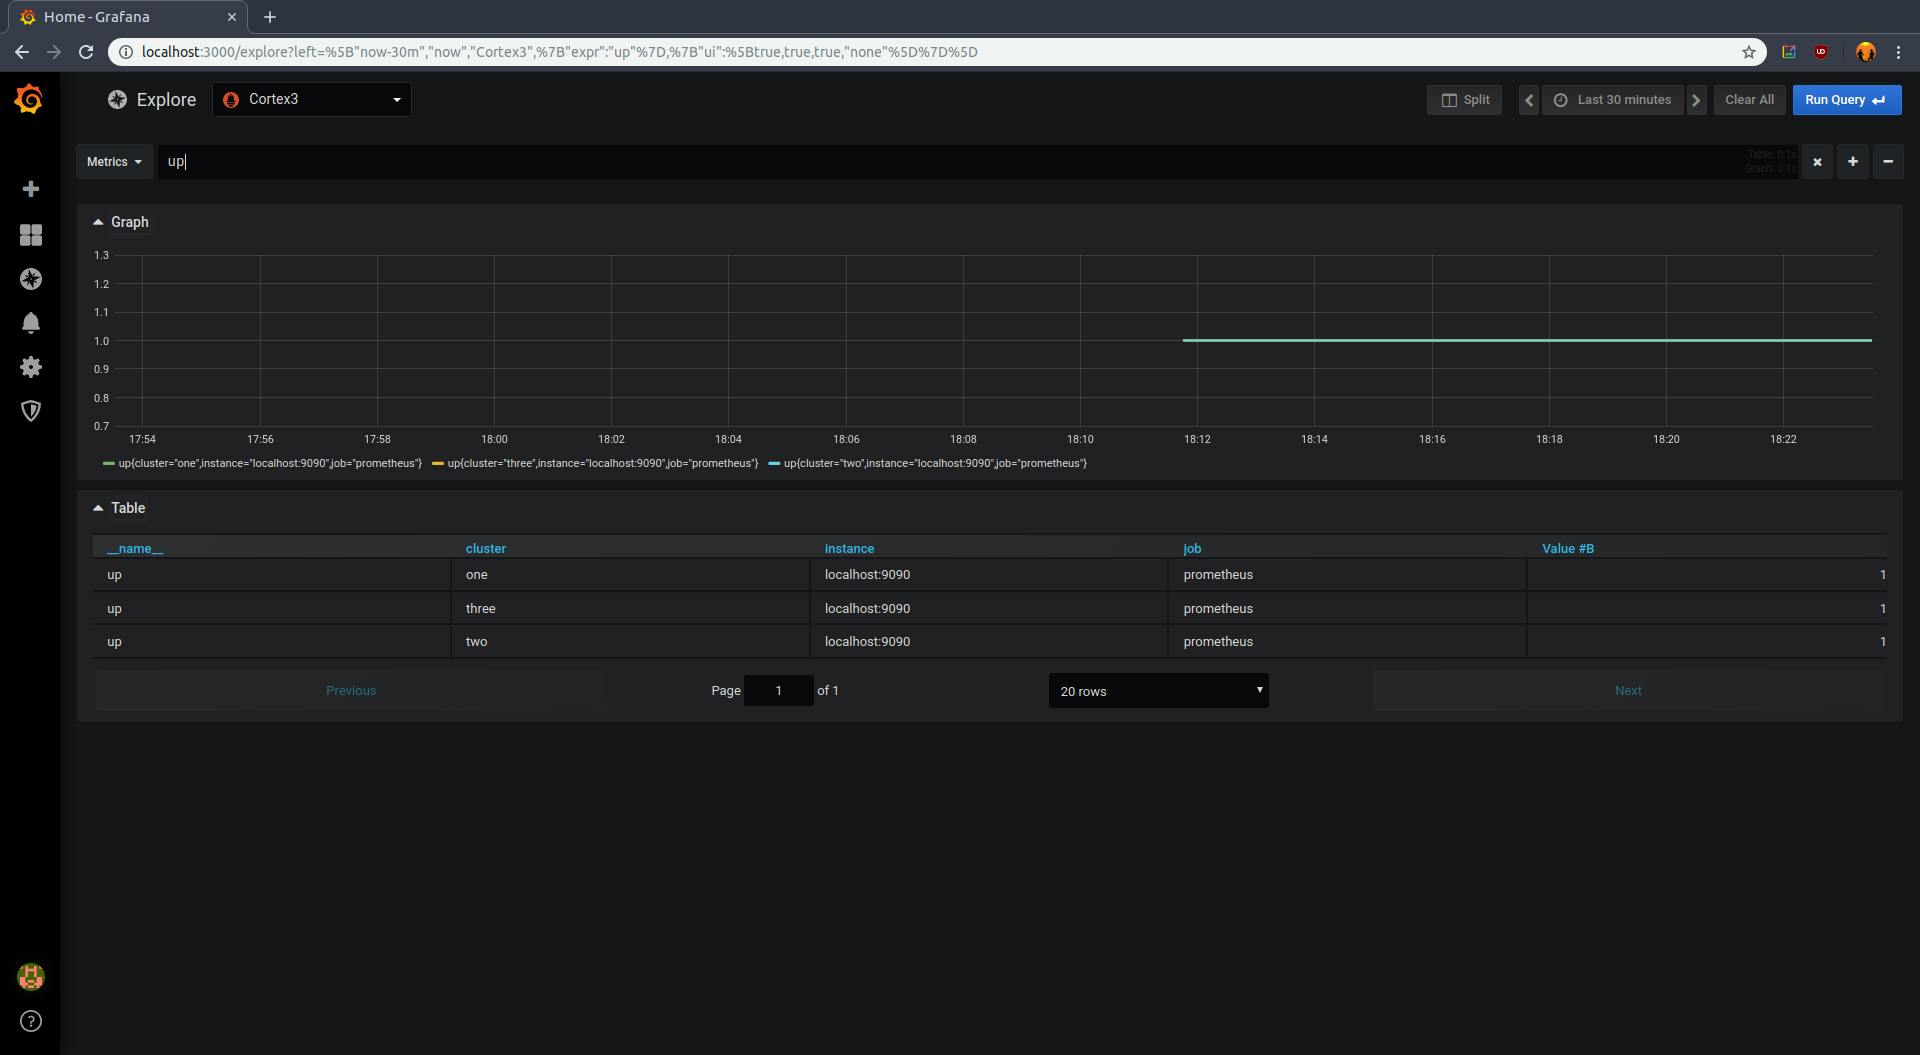
To keep things simple, we will use an all-in-one cortex config. This runs cortex as a monolithic application. We’ll run three instances of it to check replication. There are three Prometheus config files. They have an external label that is added to all metrics when performing a remote write. The Prometheus1 and Prometheus3 containers write to Cortex1 while the Prometheus2 container writes to Cortex2. We will run our queries on Cortex3. The following code snippet shows the differences in the configs of the three Prometheus instances.
# Prometheus one
global:
  # ...
  external_labels:
    cluster: two
# ...
remote_write:
- url: cortex2:9009/api/prom/push

# Prometheus two
global:
  # ...
  external_labels:
    cluster: two
# ...
remote_write:
- url: cortex1:9009/api/prom/push

# Prometheus three
global:
  # ...
  external_labels:
    cluster: tree
# ...
remote_write:
- url: cortex1:9009/api/prom/push
Use docker-compose to start all the services.
docker-compose -f docker-demo/docker-compose.yaml up
Go to localhost:3000/explore , login using the credentials admin/admin and select cortex3 as the datasource. Run a sample query (eg up). Cortex will return metrics from all 3 Prometheus containers:
Once you’re done, run the following command to clean up
docker-compose -f docker-demo/docker-compose.yaml down
Cortex & dependencies with Prometheus in Kubernetes
We will deploy Cortex as a group of microservices as shown in the architecture. We’ll also need Helm to deploy dependencies(Cassandra) and other services(Grafana, Prometheus). If you do not have Helm installed already, you can follow the quickstart guide in the Helm docs. Let’s get started, first, we’ll deploy the cortex components.
kubectl apply -f k8s/
We’ll also install a Prometheus using Helm. The command below will do that for us along with 2 additional things:
- Creates an external label called “cluster” and sets the value for that label to “one”. This will help to separate different Prometheus instances
- Set up remote write to cortex.
helm install stable/prometheus \
 --name prom-one \
 --set server.global.external_labels.cluster=one \
 --set serverFiles."prometheus\.yml".remote_write[0].url=http://nginx.default.svc.cluster.local:80/api/prom/push
Now we will deploy Grafana. The command below uses Grafana’s provisioning feature to add Cortex as a datasource on pod startup.
helm install stable/grafana --name=grafana \
 --set datasources."datasources\.yaml".apiVersion=1 \
 --set datasources."datasources\.yaml".datasources[0].name=cortex \
 --set datasources."datasources\.yaml".datasources[0].type=prometheus \
 --set datasources."datasources\.yaml".datasources[0].url=http://nginx.default.svc.cluster.local/api/prom \
 --set datasources."datasources\.yaml".datasources[0].access=proxy \
 --set datasources."datasources\.yaml".datasources[0].isDefault=true

kubectl port-forward svc/grafana 3000:80
Run the following command to get the Grafana admin password. After that, open localhost:3000/explore and log in using username “admin” and the printed password.
kubectl get secret --namespace default grafana -o jsonpath="{.data.admin-password}" | base64 --decode ; echo
Here are some sample queries you can run to test if Prometheus is sending metrics to Cortex:
up{cluster="one"}
prometheus_tsdb_head_samples_appended_total{cluster="one"}
Cleanup
kubectl delete -f k8s/
helm delete --purge prom-one
helm delete --purge grafana
The ingester pods will get stuck in the terminating phase. This is by design as ingesters are semi stateful and will attempt to flush their data to other ingesters before terminating. This makes upgrades and rollbacks possible while avoiding loss of data. In this case, we are just trying it out and don’t care about the data so we can force delete it with the following command:
kubectl delete pod -l name=ingester --grace-period=0 --force
HA Prometheus setup with de-duplication
This setup is quite similar to the previous one. The main difference is that we are deploying two Prometheus instances. Both have the cluster label which is set to the same value “one” and a replica label which is unique. The distributor component has been configured to perform de-duplication of metrics based on those two labels. If Cortex does not receive metrics from the current replica for more than a set amount of time (30s), it will failover to the next replica that sends a sample.
kubectl apply -f k8s-ha/

helm install stable/prometheus \
--name prom-one \
--set server.global.external_labels.cluster=one \
--set server.global.external_labels.replica=one \
--set serverFiles."prometheus\.yml".remote_write[0].url=http://nginx.default.svc.cluster.local:80/api/prom/push

helm install stable/prometheus \
--name prom-two \
--set server.global.external_labels.cluster=one \
--set server.global.external_labels.replica=two \
--set serverFiles."prometheus\.yml".remote_write[0].url=http://nginx.default.svc.cluster.local:80/api/prom/push

helm install stable/grafana --name=grafana \
--set datasources."datasources\.yaml".apiVersion=1 \
--set datasources."datasources\.yaml".datasources[0].name=cortex \
--set datasources."datasources\.yaml".datasources[0].type=prometheus \
--set datasources."datasources\.yaml".datasources[0].url=http://nginx.default.svc.cluster.local/api/prom \
--set datasources."datasources\.yaml".datasources[0].access=proxy \
--set datasources."datasources\.yaml".datasources[0].isDefault=true

kubectl port-forward svc/grafana 3000:80
Run the following command to get the grafana admin password. After that, open localhost:3000/explore and login using username “admin” and the printed password.
kubectl get secret --namespace default grafana -o jsonpath="{.data.admin-password}" | base64 --decode ; echo
Here are some sample queries you can run to test if Prometheus is sending metrics to Cortex:
up{cluster="one"}
prometheus_tsdb_head_samples_appended_total{cluster="one"}
To test HA, we can try deleting one of the Prometheus pods.
kubectl delete pod -l app=prometheus,component=server,release=prom-one
There should be no gaps in the Grafana graphs as Cortex will failover to the other instance.
Cleanup
kubectl delete -f k8s/
helm delete --purge prom-one
helm delete --purge prom-two
helm delete --purge grafana
Use Cassandra as index and chunk storage
In the previous two examples, we were using dynamodb-local as the index storage and fakes3 as the chunk storage. In this example, we’ll be using Apache Cassandra for both index and block storage.
The following commands will enable the helm incubator repo, install Cassandra using helm, and wait for the 3 replicas to be ready.
helm repo add incubator kubernetes-charts-incubator.storage.google…
helm install --wait --name=cassie incubator/cassandra
Once Cassandra is ready, proceed with installing all the other services.
kubectl apply -f k8s-cassandra/

helm install stable/prometheus \
--name prom-one \
--set server.global.external_labels.cluster=one \
--set serverFiles."prometheus\.yml".remote_write[0].url=http://nginx.default.svc.cluster.local:80/api/prom/push

helm install stable/grafana --name=grafana \
--set datasources."datasources\.yaml".apiVersion=1 \
--set datasources."datasources\.yaml".datasources[0].name=cortex \
--set datasources."datasources\.yaml".datasources[0].type=prometheus \
--set datasources."datasources\.yaml".datasources[0].url=http://nginx.default.svc.cluster.local/api/prom \
--set datasources."datasources\.yaml".datasources[0].access=proxy \
--set datasources."datasources\.yaml".datasources[0].isDefault=true
kubectl port-forward svc/grafana 3000:80
Run the following command to get the Grafana admin password. After that, open localhost:3000/explore and login using username “admin” and the printed password.
kubectl get secret --namespace default grafana -o jsonpath="{.data.admin-password}" | base64 --decode ; echo
Here are some sample queries you can run to test if Prometheus is sending metrics to Cortex:
up{cluster="one"}
prometheus_tsdb_head_samples_appended_total{cluster="one"}
Cleanup
kubectl delete -f k8s/
helm delete --purge cassie
helm delete --purge prom-one
helm delete --purge grafana
Conclusion
Cortex is a powerful tool for running multiple Prometheus servers seamlessly while simplifying the operations and usage for end-users. While Thanos does provide very similar features – the way they implement it is drastically different. The use cases that an organization is trying to implement will drive the choice of Cortex vs Thanos. But cortex indeed makes running a highly scalable and resilient Prometheus based monitoring system easy.
PS: You can refer to this blog if you're curious about using Thanos instead Cortex for running Thanos for HA Prometheus.
References and related blog posts
- https://medium.com/weaveworks/what-is-cortex-2c30bcbd247d
- Cortex architecture
- Cortex Getting Started
- Intro to Cortex (video)
- Cortex Deep dive (video)
- Running Thanos for HA Prometheus
- CloudWatch or Prometheus in EKS?
- Install Prometheus with operator