Prathmesh Vibhuteprathmeshh.hashnode.dev·19 hours agoDay 78 : Grafana CloudAs organizations scale their cloud infrastructure, monitoring becomes a crucial aspect of maintaining performance, cost-efficiency, and security. Grafana Cloud, a powerful analytics and monitoring platform, offers robust capabilities to visualize met...Discussday78
Prathmesh Vibhuteprathmeshh.hashnode.dev·May 17, 2024Day 77 : Grafana Cloud AlertingIn the fast-paced world of modern IT, timely issue detection and resolution can make or break your operations. Grafana Cloud Alerting is a powerful tool designed to keep your systems running smoothly by notifying you of problems the moment they occur...Discuss#day77
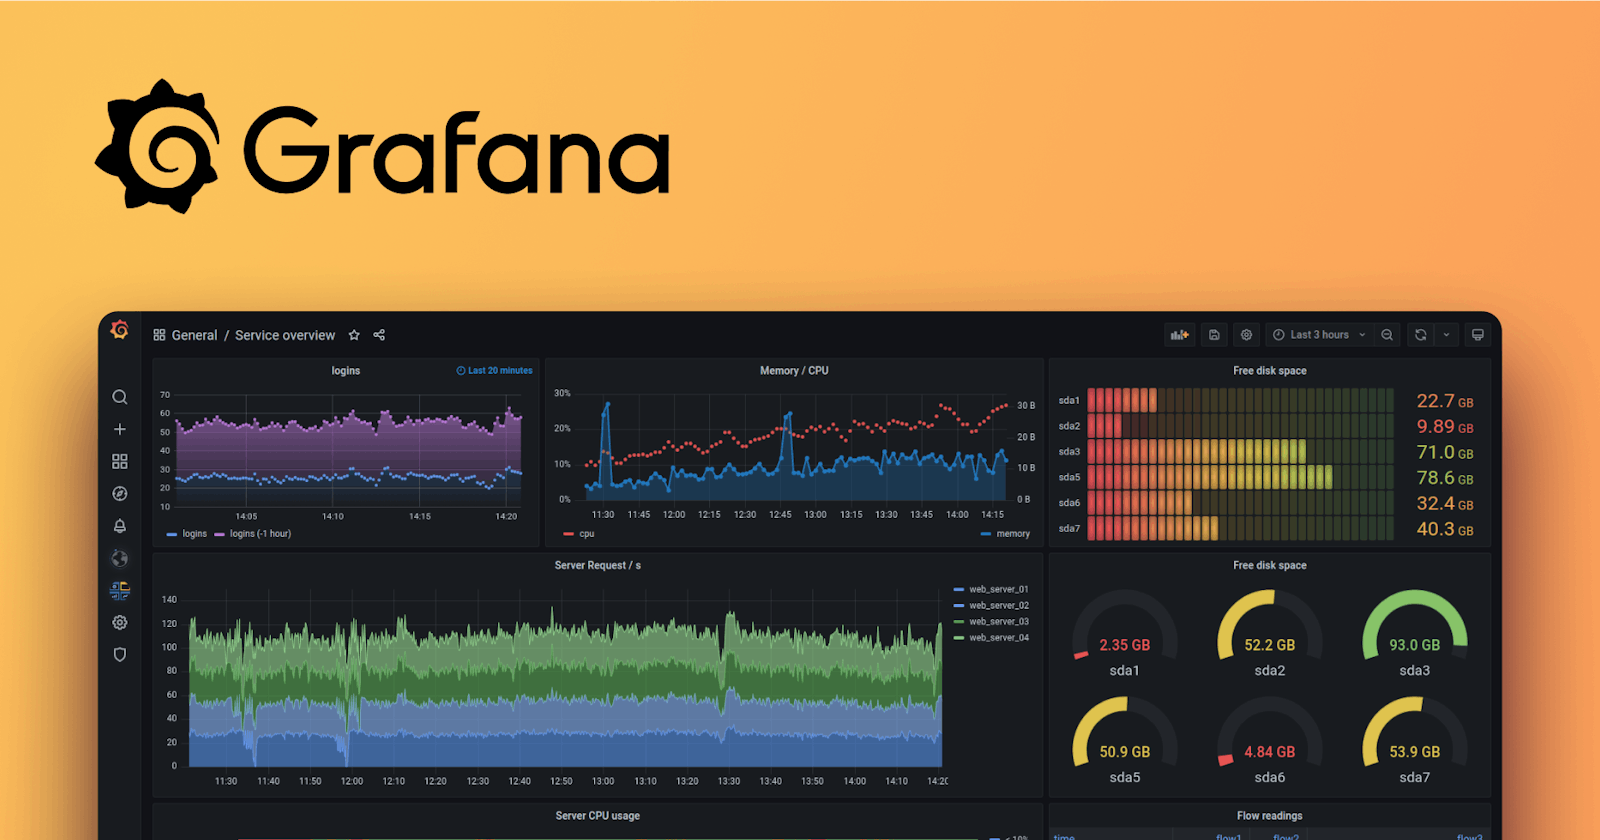
Prathmesh Vibhuteprathmeshh.hashnode.dev·May 17, 2024Day 76 : Build a Grafana dashboardA Grafana dashboard provides an at-a-glance view of your data, enabling you to track key metrics through various visualizations. These dashboards are composed of panels, each depicting a different aspect of the story your data tells. Each panel is dr...Discussday76
Prathmesh Vibhuteprathmeshh.hashnode.dev·May 16, 2024Day 75 : Sending Docker Log to GrafanaMonitoring is the backbone of any modern software infrastructure, ensuring that everything runs smoothly and issues are promptly addressed. With tools like Grafana and Docker, you can take your monitoring game to the next level by seamlessly integrat...Discuss·67 readsday75
Prathmesh Vibhuteprathmeshh.hashnode.dev·May 15, 2024Day 74 : Connecting EC2 with Grafana .In the dynamic world of cloud computing, monitoring server health and performance is crucial. Grafana, an open-source analytics and monitoring platform, is a popular tool for visualizing metrics. In this blog post, we'll walk through connecting both ...Discuss·1 like#day74
Prathmesh Vibhuteprathmeshh.hashnode.dev·May 15, 2024Day 73 : Grafana SetupGrafana is a powerful open-source tool for data visualization and monitoring. Whether you're keeping an eye on infrastructure performance or analyzing business metrics, Grafana provides a dynamic and intuitive interface. Setting it up on AWS EC2 can ...Discuss·28 reads#day73
Prathmesh Vibhuteprathmeshh.hashnode.dev·May 15, 2024Day 72 : Grafana🔥In the world of data analytics and monitoring, Grafana stands out as a powerful and versatile tool. But what exactly is Grafana, and why is it so popular? Let's dive in and explore the features, benefits, and various uses of Grafana. What is Grafana?...Discuss#day72
Varun1010varun.hashnode.dev·May 7, 2024Logging using Grafana and LokiIn this article, we will set logging services like Grafana for our docker containers.Only in simple three steps, we will achieve our Grafana dashboard. Step 1: Set up Loki on your machine. For setting up Loki, I prefer the Loki docker image becaus...Discuss·61 readsGrafana Monitoring
Cloud Tunedcloudtuned.hashnode.dev·Apr 19, 2024Daily Hack #day16 - Quick Start with Grafana DashboardsGrafana dashboards are powerful visualization tools that provide insights into complex data sets with clarity and efficiency. With Grafana, users can create customized dashboards that display real-time metrics, logs, and other data sources in a visu...DiscussDaily HacksGrafana
Mahdi Shadimahdishadi.me·Apr 18, 2024Monitoring internet Speed with Zabbix and GrafanaZabbix is an open-source monitoring software tool used for monitoring diverse IT components, including networks, servers, virtual machines, and cloud services. It's designed to provide real-time insights into the performance and availability of vario...Discuss·1 likeZabbix