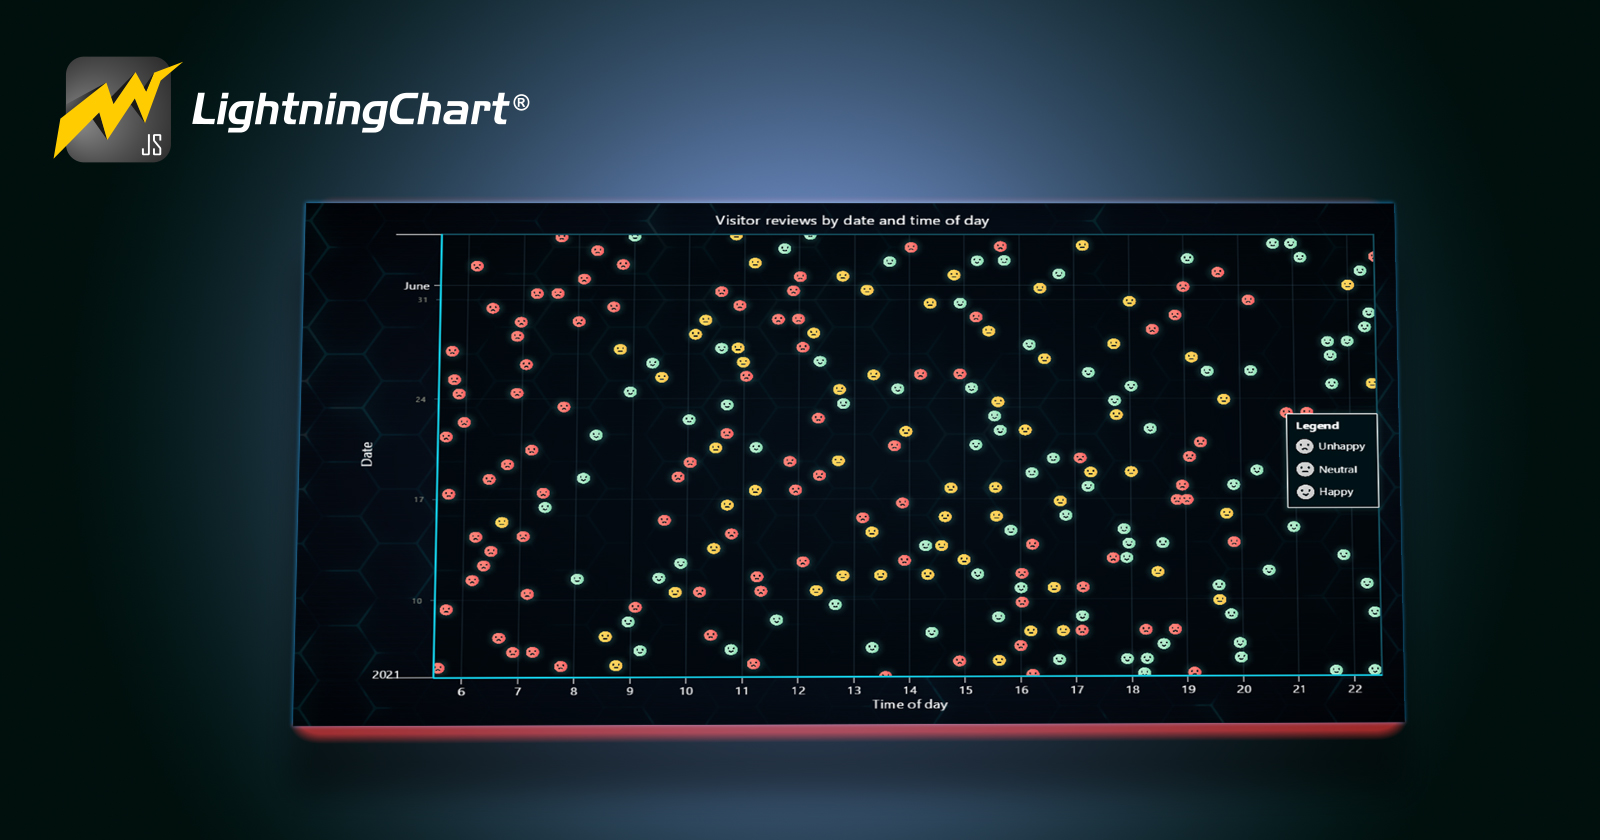
Building a JavaScript Scatter Chart for Analyzing Customer Satisfaction
This article will use an XY chart to create a scatter chart with custom images for each data point series for analyzing customer satisfaction using personalized images.
We will assign personalized emojis to help us identify the level of customer sati...
lightningchart.hashnode.dev8 min read