Day 2 of 100 Days of Code
Today I learned how to create bar charts and bubble charts with plotly and pandas in Python. I tried to recreate the "Life expectancy vs GDP per capita" graph by downloading the csv file that's available on the website and reading it into my datafra...
sania2046.hashnode.dev1 min read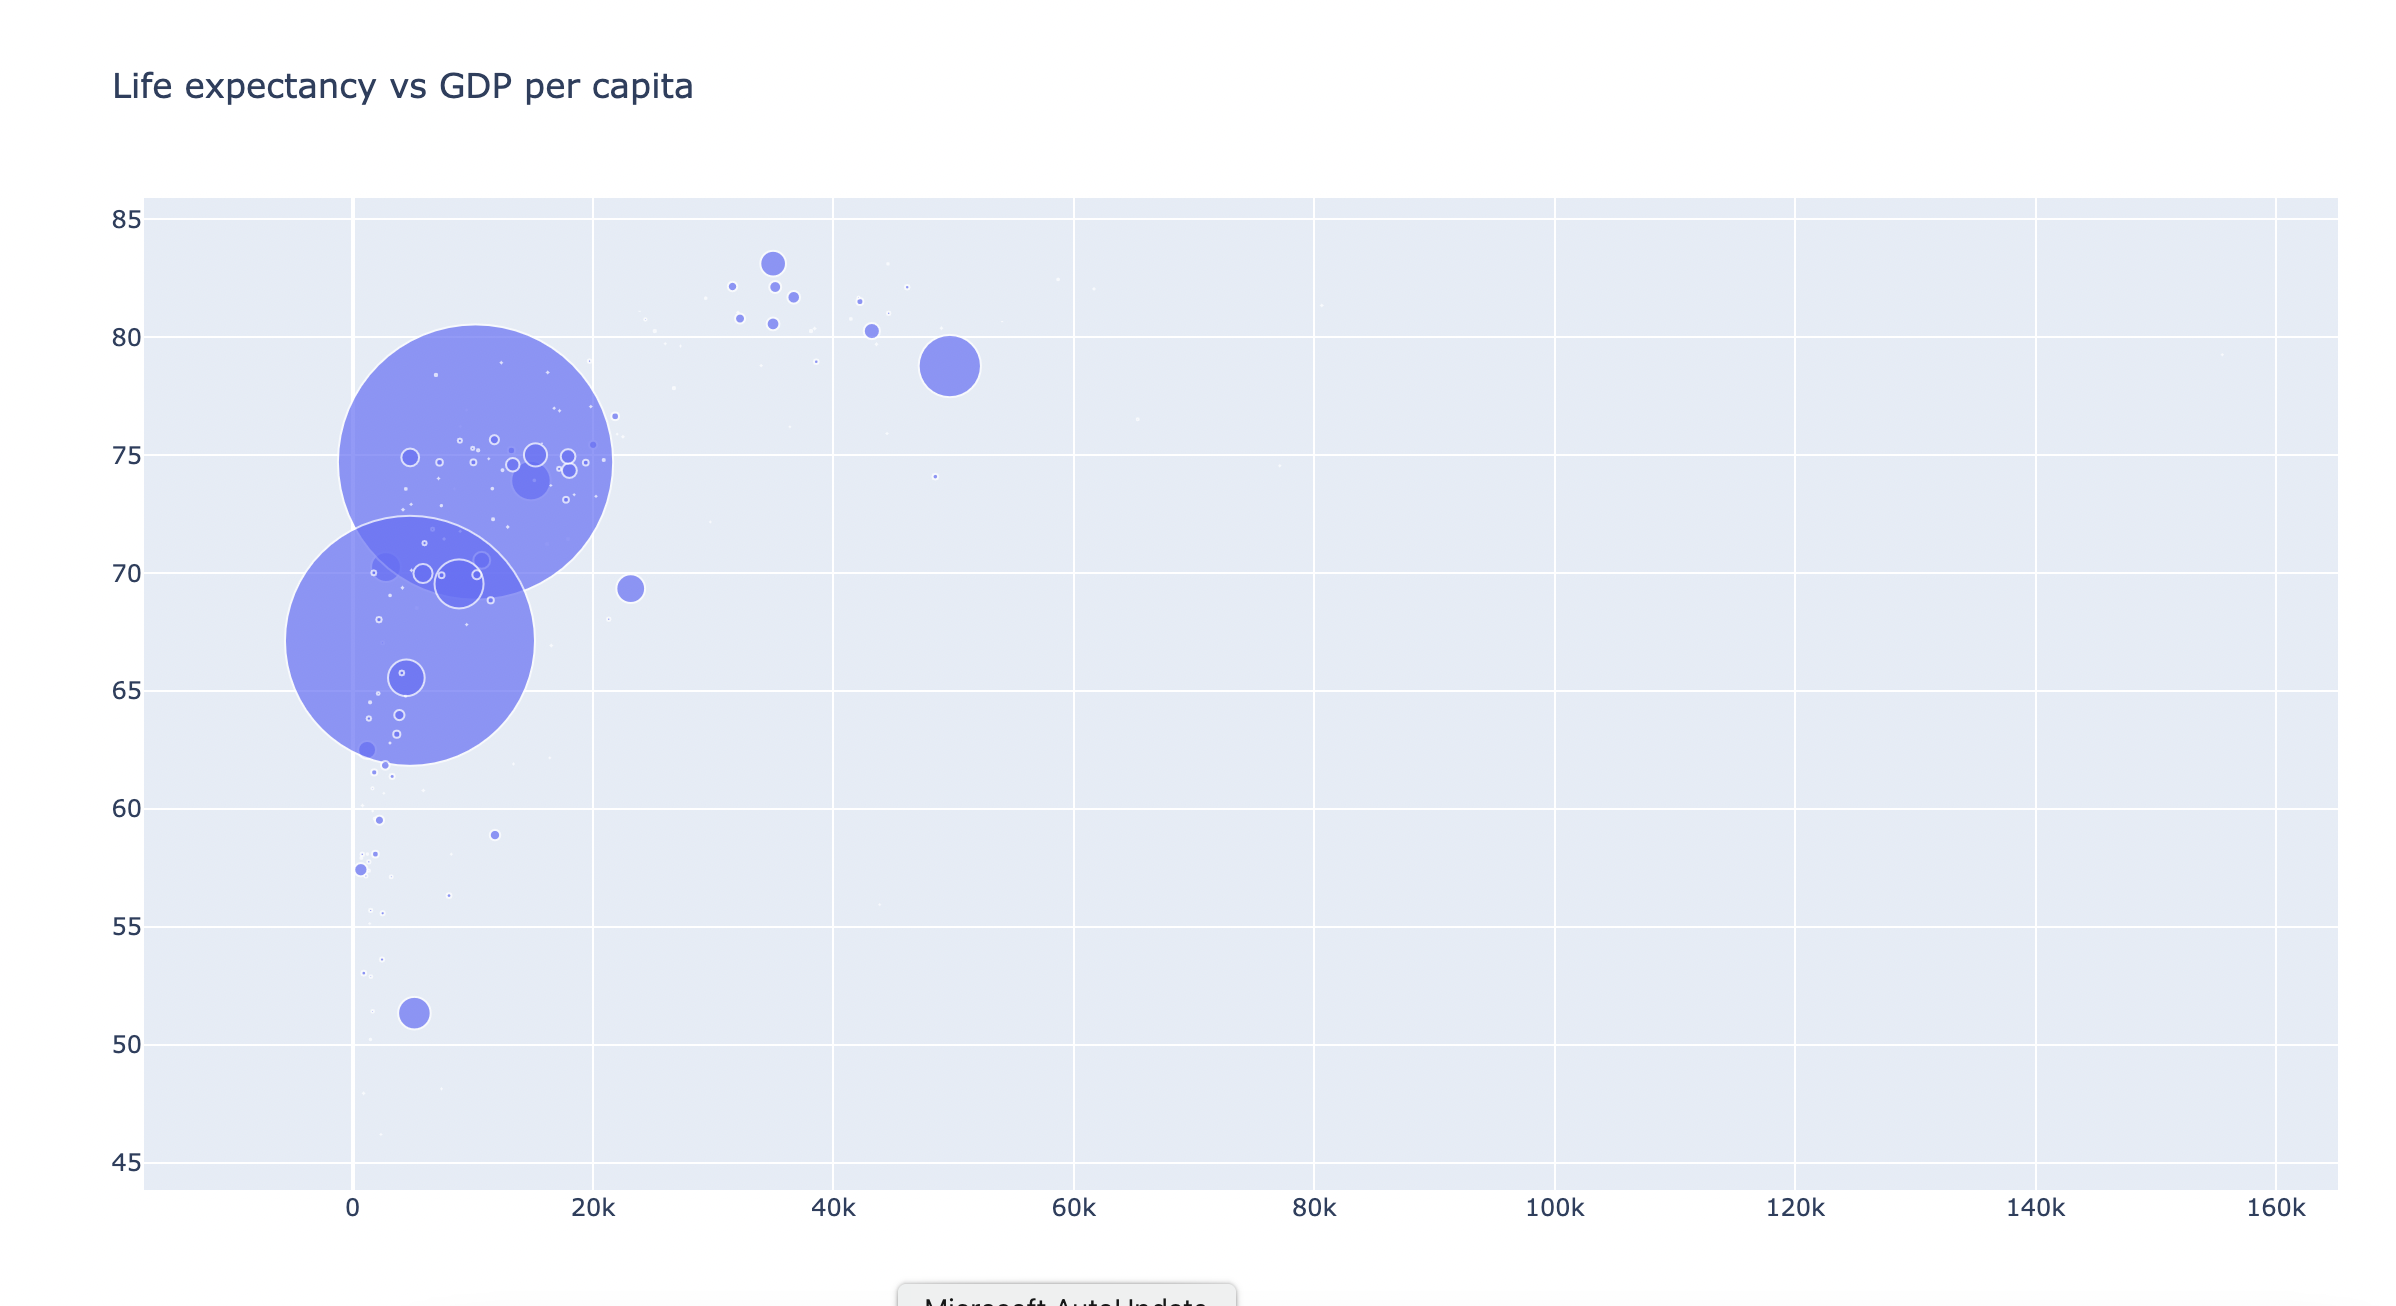
Eleftheria Batsou
Community Manager | Developer & UX | Youtuber ❤
Good luck with the challenge Sania Kudaibergen and happy new year :)