Day 3 of 100 Days of Code
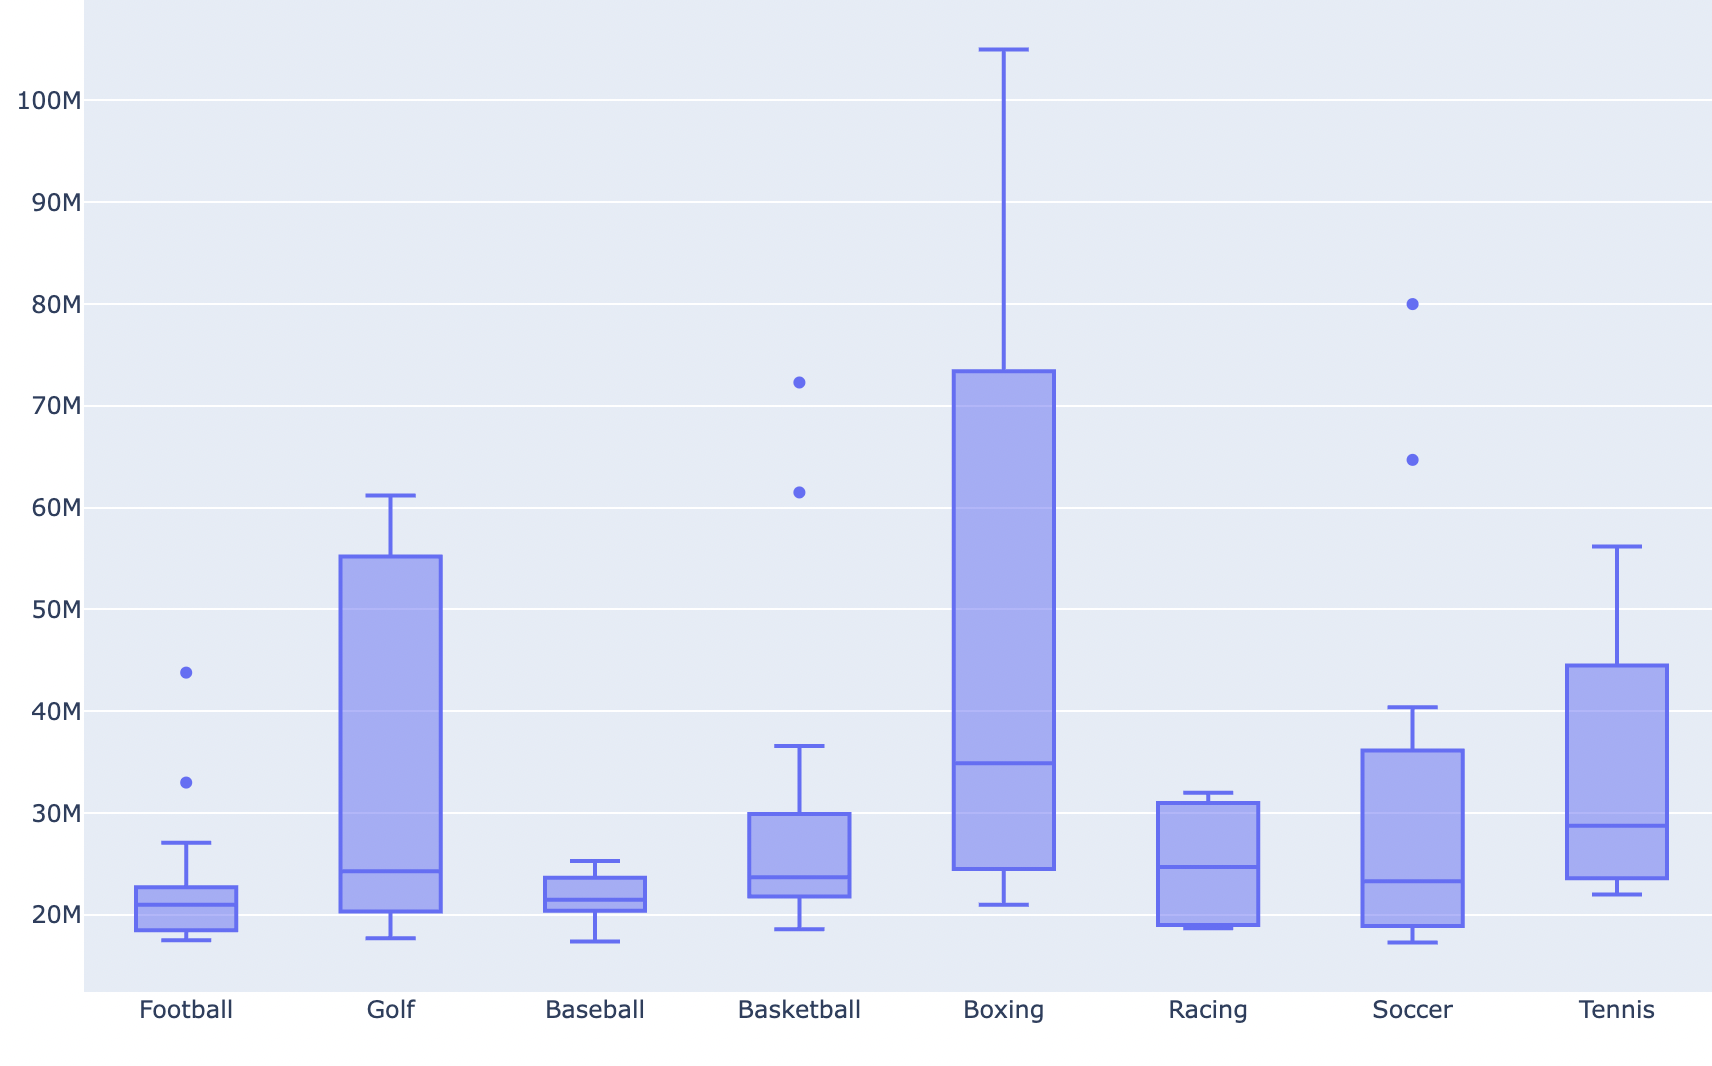
Continuing the theme of visualising data with Python, today I learned how to create boxplots with Plotly Graph Objects. Box plots visualise the variation in a dataset by representing the continuous numerical data through quartiles. They are useful fo...
sania2046.hashnode.dev1 min read