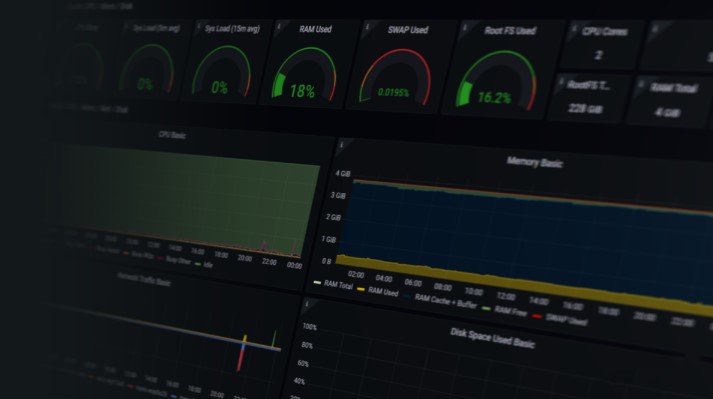
📉How to install grafana on linux and how to setup with prometheus (whole setup).🚀
Grafana, paired with Prometheus and Node Exporter, is a powerful monitoring stack for system and application metrics. Prometheus collects metrics from Node Exporter, which provides system stats like CPU, memory, and disk usage. Grafana connects to Pr...
Written by
system and cloud administrator at Appharu PVT. LTD
🌐 DevOps Enthusiast | Cloud & System Administrator | WordPress Expert With 2+ years of experience, I specialize in cloud infrastructure, server management, and WordPress development. At Appharu PVT. LTD., I optimize systems, reduce costs, and implement monitoring solutions. Experienced in deploying 50+ WordPress sites, AWS S3 integration, and troubleshooting technical issues, I’m focused on performance, security, and continuous learning in DevOps and automation.
Responses
Markdown supported · ⌘↵ to post
No responses yet.