Know Your AWS Cost Datasets - Why My AWS RDS Cost Graphs Look Different?
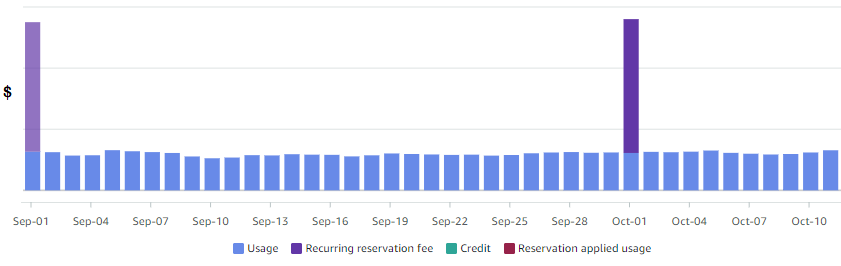
Although the below graphs are generated for the same time frame and AWS RDS service in AWS Cost Explorer, why does the daily cost of the service seem to vary over time? There are numerous reasons why these graphs appear different when viewed separat...
Responses
Markdown supported · ⌘↵ to post
No responses yet.