The journalctl example is particularly interesting because a successful exit code doesn't necessarily mean the data was actually readable.
I’ve seen this same design problem come up in observability pipelines: imagine a Prometheus exporter that keeps returning HTTP 200, but a permission change prevents its collector from reading kernel or hardware metrics. The scrape succeeds, up stays at 1, and a dashboard can look perfectly healthy while the underlying measurements are missing or stale.
I’d be tempted to give each signal three separate states: healthy, unhealthy, and unknown, with freshness tracked independently. A successful scrape should prove that the endpoint responded, not that every collector produced valid data. Do you plan to expose per-signal collection timestamps or last-success times in FoxWatch? That could help distinguish a genuinely quiet machine from one whose monitoring has quietly stopped working.
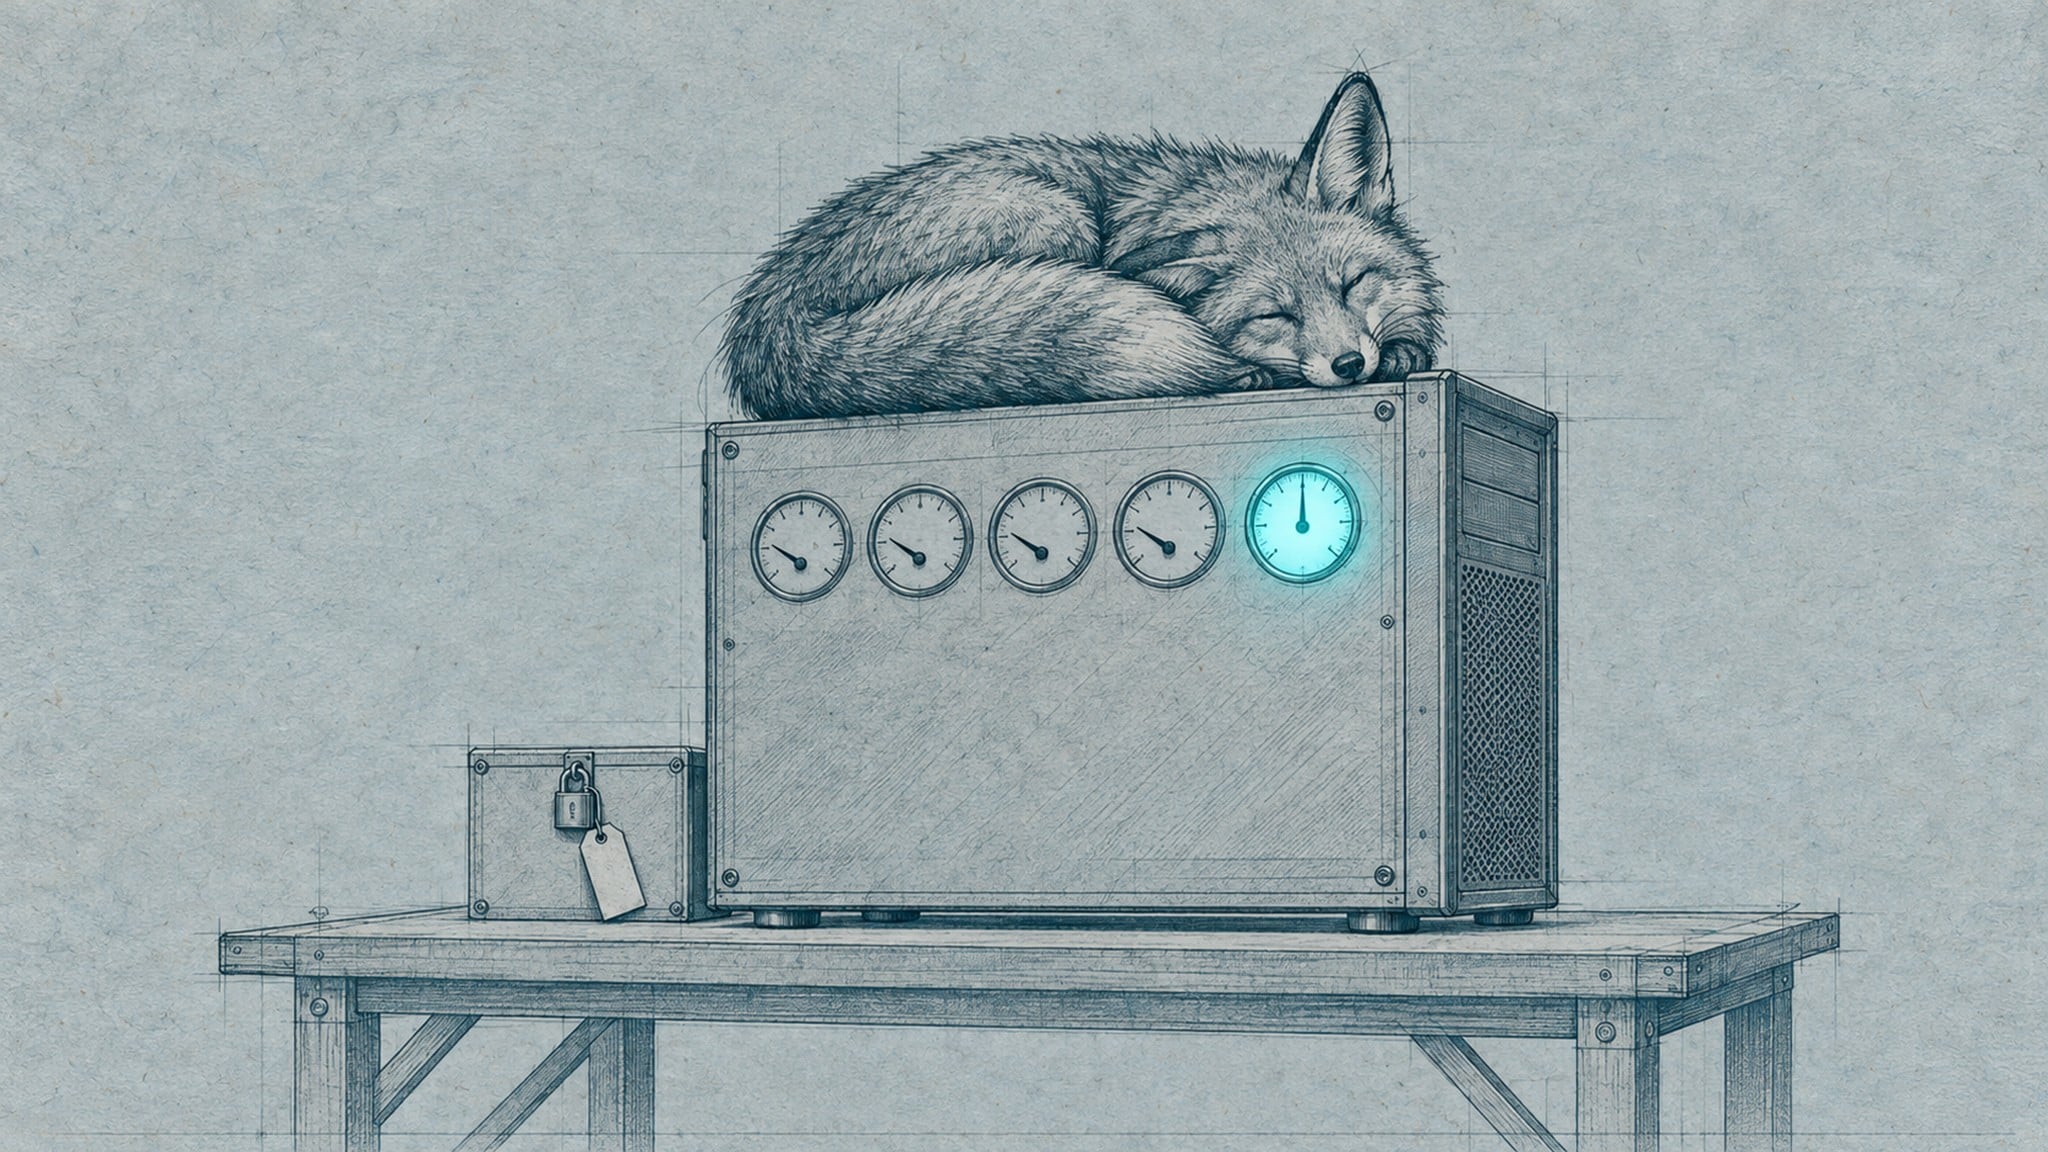
It already works roughly that way. Each signal source keeps its own freshness, and "stale" is its own state, never green: the command line shows how long ago a source last reported, and if every source goes stale, the tray fox doesn't show all-clear. Your Prometheus example is the same trap as the journalctl one: the call succeeded, the data didn't arrive.
That distinction matters even more when you look at the telemetry pipeline itself. Take an OpenTelemetry Collector running with a persistent exporter queue: the receiver can keep accepting spans while the backend is unavailable, so ingestion looks healthy even as the queue grows and delivery falls behind. If the collector only reports its own process health, you can miss the actual failure until the queue fills and data starts getting dropped. I'd be interested in whether FoxWatch's freshness model also distinguishes a source that hasn't produced new data from one whose latest data was collected successfully but never made it through the rest of the pipeline. Those are two very different failure modes, and collapsing them into a single stale state can hide where the break actually happened.
The
journalctlexample is particularly interesting because a successful exit code doesn't necessarily mean the data was actually readable.I’ve seen this same design problem come up in observability pipelines: imagine a Prometheus exporter that keeps returning HTTP 200, but a permission change prevents its collector from reading kernel or hardware metrics. The scrape succeeds,
upstays at1, and a dashboard can look perfectly healthy while the underlying measurements are missing or stale.I’d be tempted to give each signal three separate states: healthy, unhealthy, and unknown, with freshness tracked independently. A successful scrape should prove that the endpoint responded, not that every collector produced valid data. Do you plan to expose per-signal collection timestamps or last-success times in FoxWatch? That could help distinguish a genuinely quiet machine from one whose monitoring has quietly stopped working.