

Measuring Productivity Of Your Software Development Team With Agile Metrics


Productivity in software development is typically tricky to measure. Is it how fast your team are doing something? It has been proven time and again that lines of code is a poor measure; are the number of modules an indicator? The degree of module reuse within a project, or from previous projects?
The Agile software development methodology has some metrics specific to this work framework that can help to measure your team’s productivity levels. Let’s dive in.
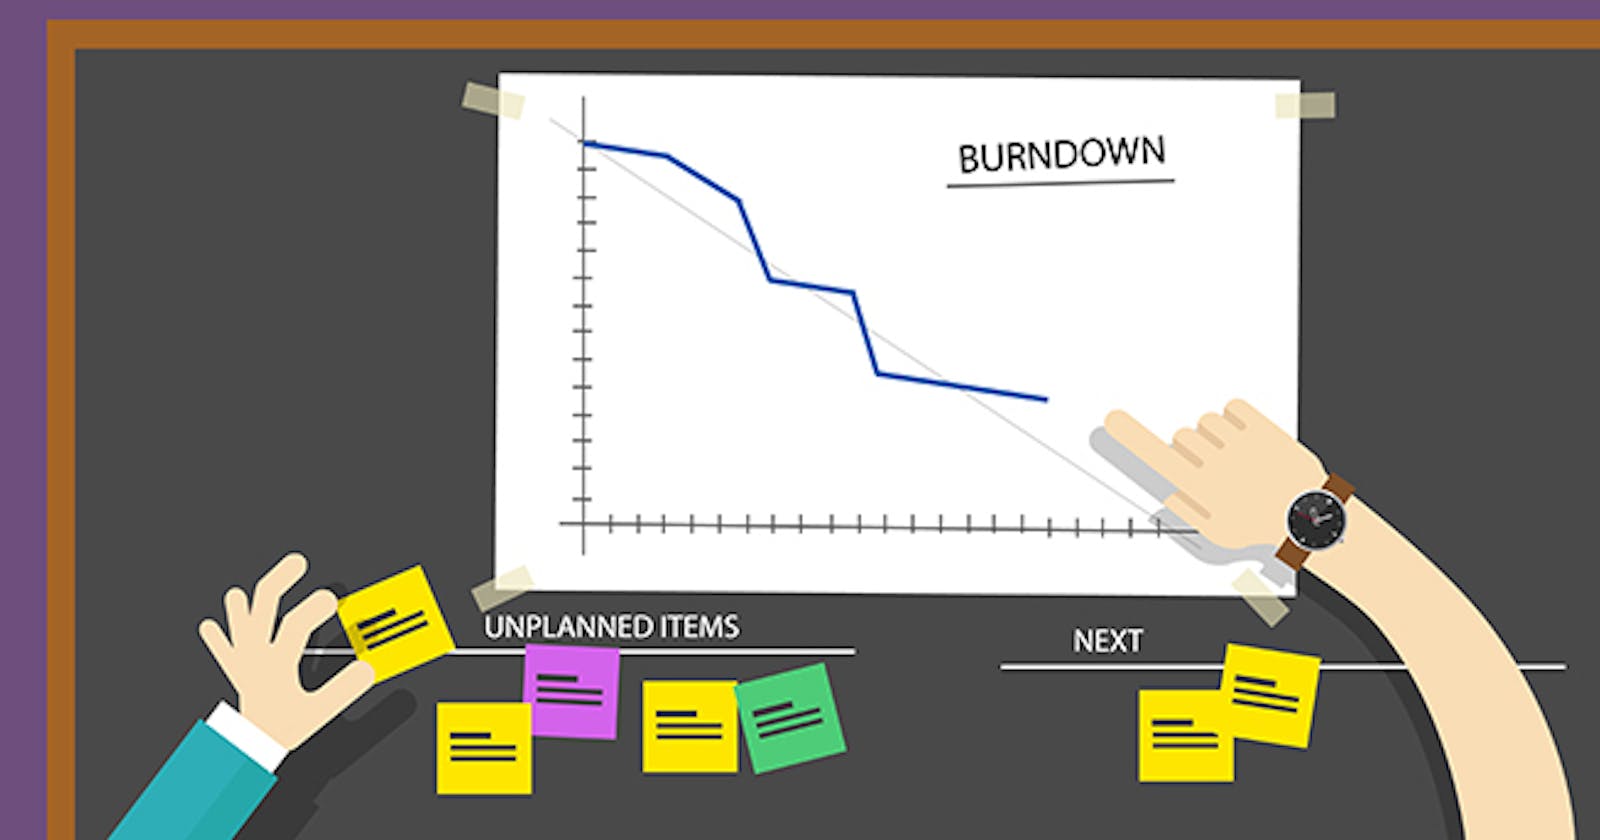
Hitting task goals: Sprint burndown reports
A Sprint is an organised unit of time during which developers have planned tasks to complete. A Sprint length is typically between one and four weeks. At the start of each Sprint developers outline the tasks they think they’ll be able to complete across the time period. At the end of the Sprint, they report whether tasks are to be started, incomplete, or complete. By tracking these end burndown reports, you’ll be able to see if your team are hitting their productivity goals.
This metric can be misleading if you aren’t careful, though. If your team are setting low goals for themselves, overcommitting, or reporting tasks complete when they’re “almost complete,” then the accuracy of this metric for productivity purposes is unreliable.
Similar to Sprints, longer time periods/units of work come in the form of Epics and Releases, with higher-level tasks. The burndown reports from these units of work can be used similarly to your Sprint burndowns for tracking purposes.
Velocity: Story point tracking
Story points are a subjective measurement used within a team to estimate complexity of completing a particular user story (i.e. a complete end-user task). From this task, developers can derive requirements for the software and estimate how complex the task itself is to create. Story point sizes are outlined in sizes that follow the Fibonacci sequence: 1, 2, 3, 5, 8, 13, 21, 34, etc. This way each story has a particular size (complexity) as compared to other stories.
Note that this relative size does not equate to man-hours. One person may complete a size 2 story in 5 hours, whereas it may take another developer 9 hours. The actual hours taken can depend a lot on experience, skill, and motivation. On the other hand, it can also depend on adherence to best practices, code quality, and testing. This is why it’s never clear from a story time-tracking metric alone which developer is actually more productive.
The amount of total story points covered over a particular sprint can be a useful measure of team velocity.
Teams themselves will need to assess code best practice adherence, quality, and testing to measure the effectiveness of story point tracking as a group and as individuals.
Cycle times
How long do issues take to resolve? That’s specifically what the cycle time metric looks at. As individual issues arise, you can track how quickly each is resolved, as well as see when many issues arise at once, whether teams are adept at handling them at a good pace - or whether they get overwhelmed.
Teams that consistently fix issues within a reasonable timeframe, and don’t get overwhelmed when an influx of issues arises at once can be trusted to work consistently well.
Another key issue tracking technique is visualising all issues over time: outstanding, in progress, and completed. If you have a disproportionate number of issues left in outstanding, or in progress, then these can quickly pile up and outweigh the issues that have been completed. To address this, there may be times when new work needs to be paused to remove the backlog of outstanding issues. Don’t think of this as an irritant or setback - it’s a necessity to keep a project on track.
Other Agile productivity metrics
There are plenty of other productivity metrics you can use that fit in well with the Agile methodology - ranging from the duration of open Git pull requests, to test coverage, and average time between releases. Some of these metrics will be more effective than others, depending on the team, workflow, and type of project. The trick is to have systems where these things can be measured easily, so you can pull up metrics reports should you feel they’ll be helpful.