FeedDiscussion
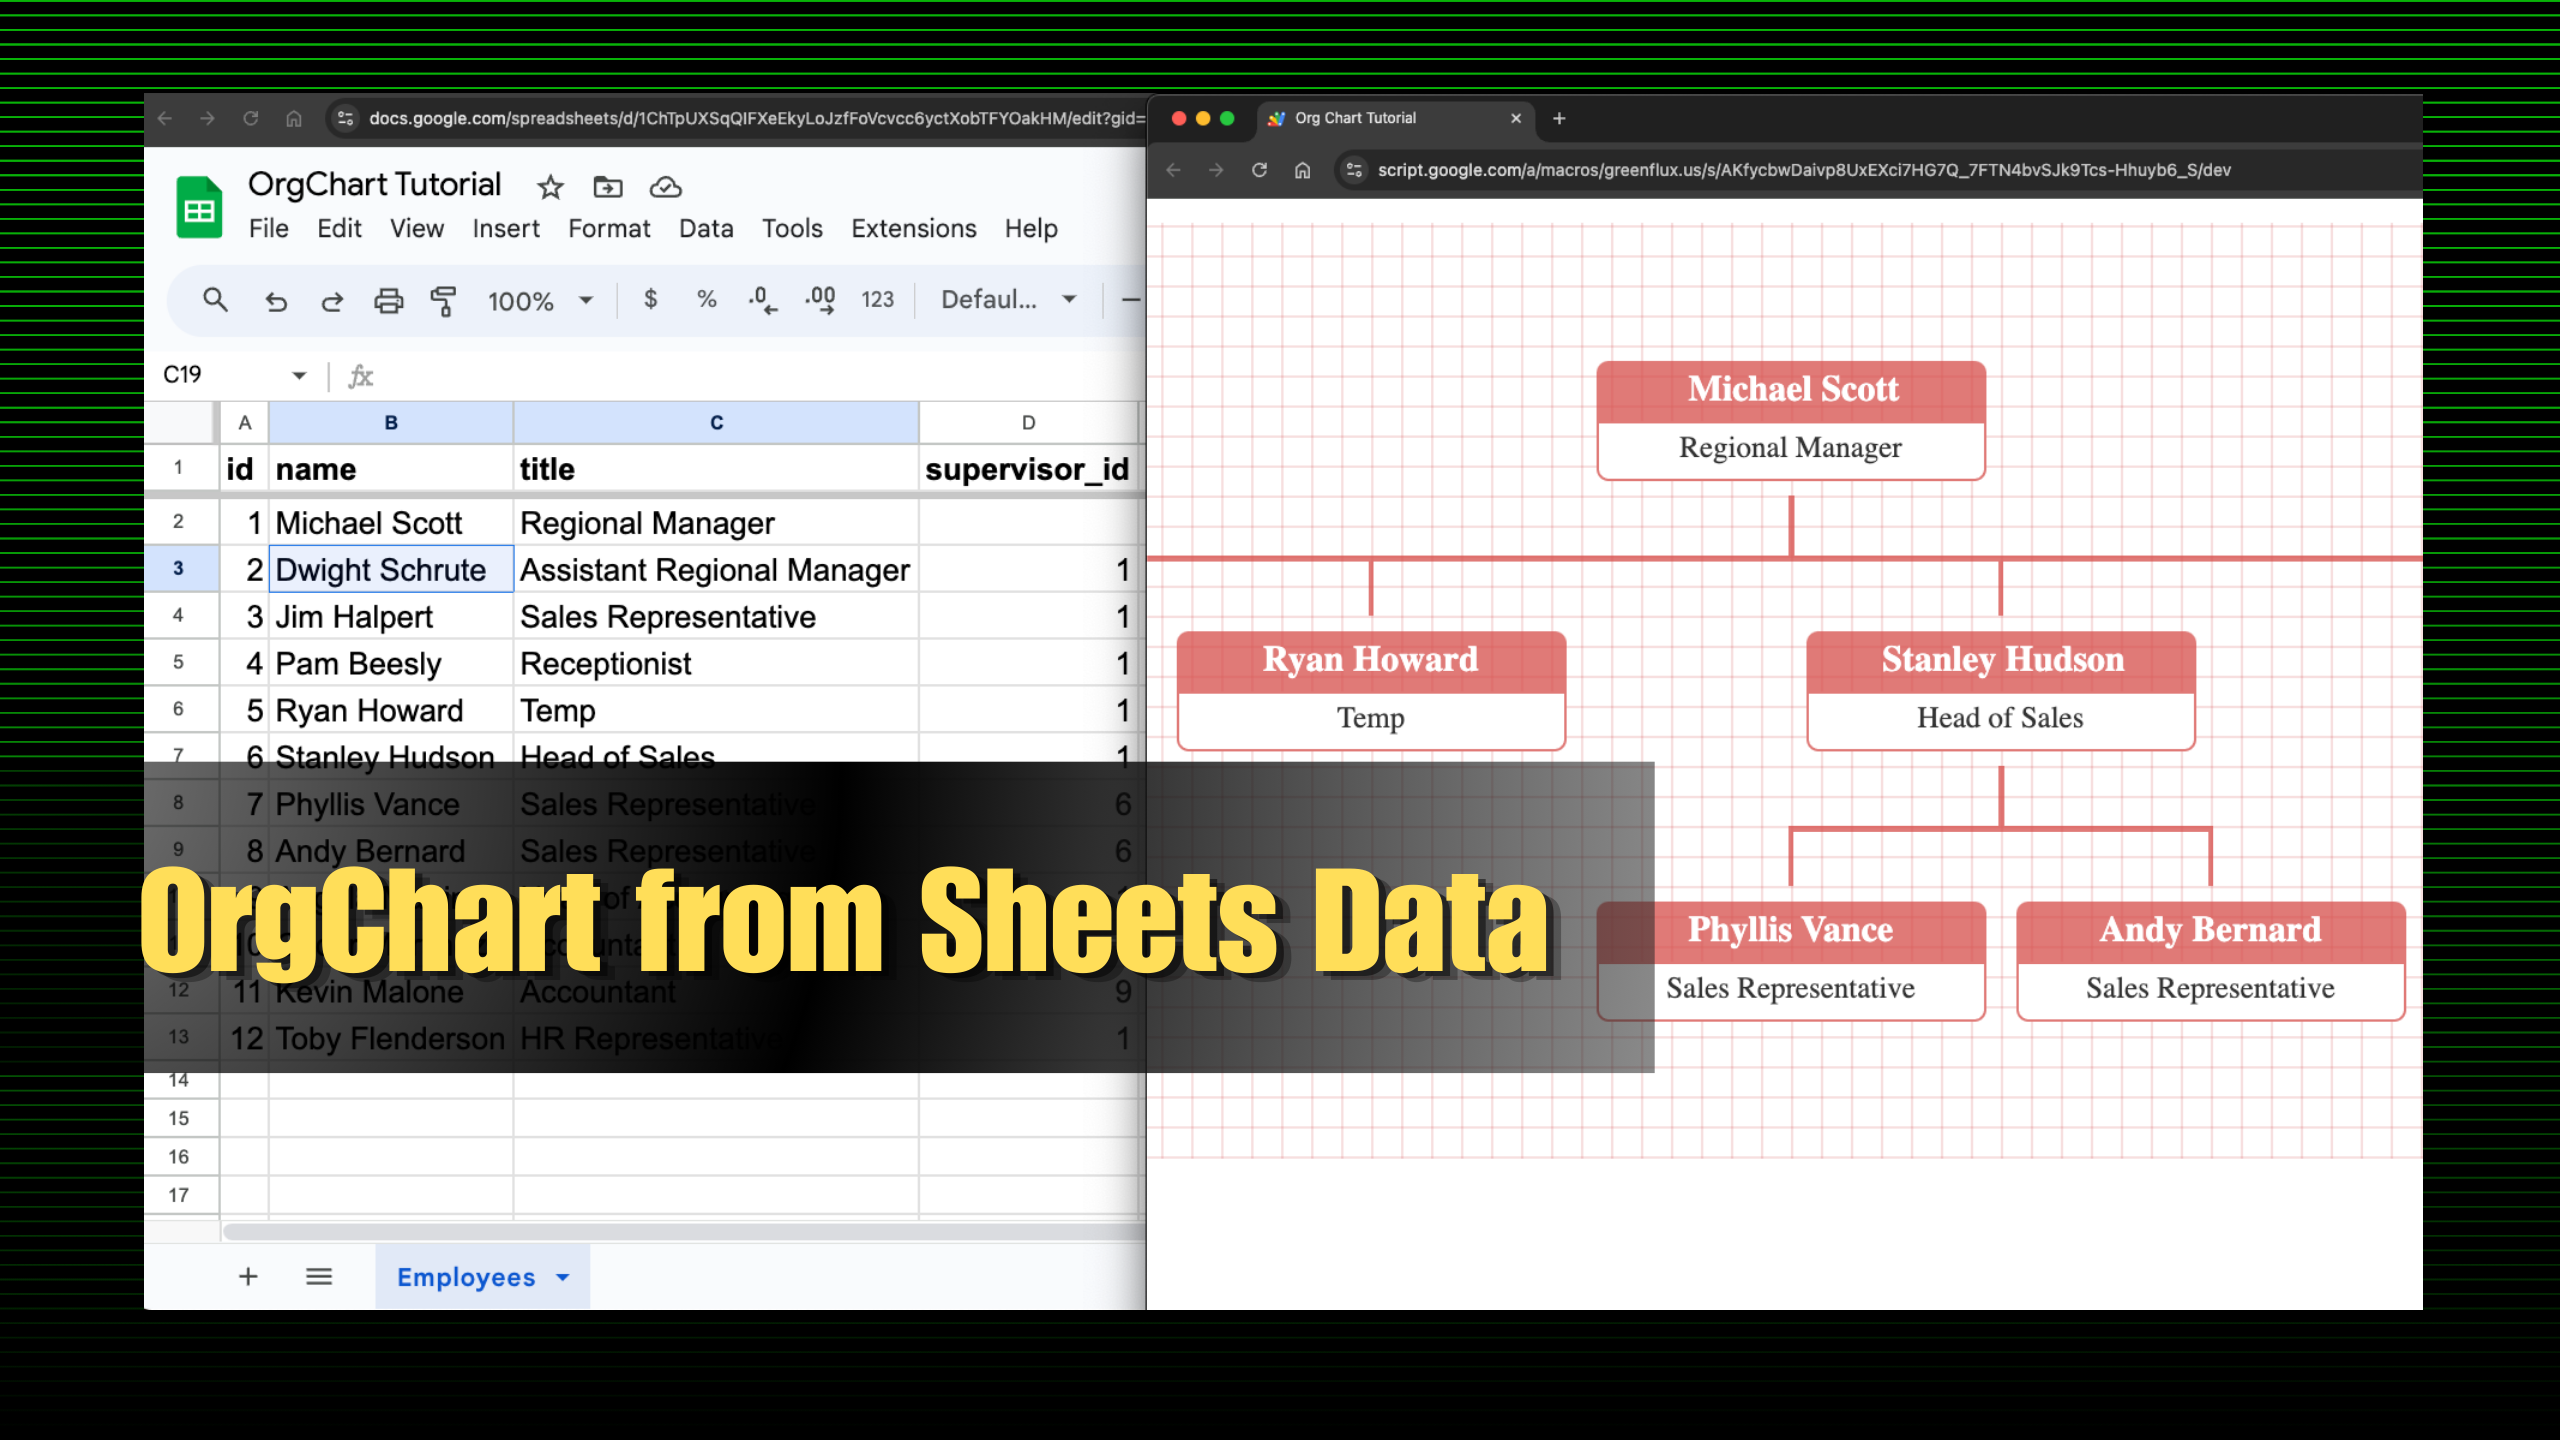
Creating a data-driven organizational chart in Google Apps Script enables dynamic visualization of team structures. By pulling data directly from Google Sheets, you can automate updates, ensuring the chart reflects real-time changes. This solution is scalable, enhances collaboration, and saves time on manual updates across departments.
If you enjoyed this post, please join us at the #LowCodeDevs squad on Daily.dev for more lowcode tips & tricks, tutorials, and other content. dly.to/SGjNAKXF8ru
Jani jan
games
Using Google Apps Script to build a data-driven organizational chart allows teams to visualize hierarchy and relationships dynamically. By connecting the chart to Google Sheets, updates are automated, reflecting real-time changes in structure. This approach boosts efficiency, ensuring teams have accurate, up-to-date organizational insights effortlessly.