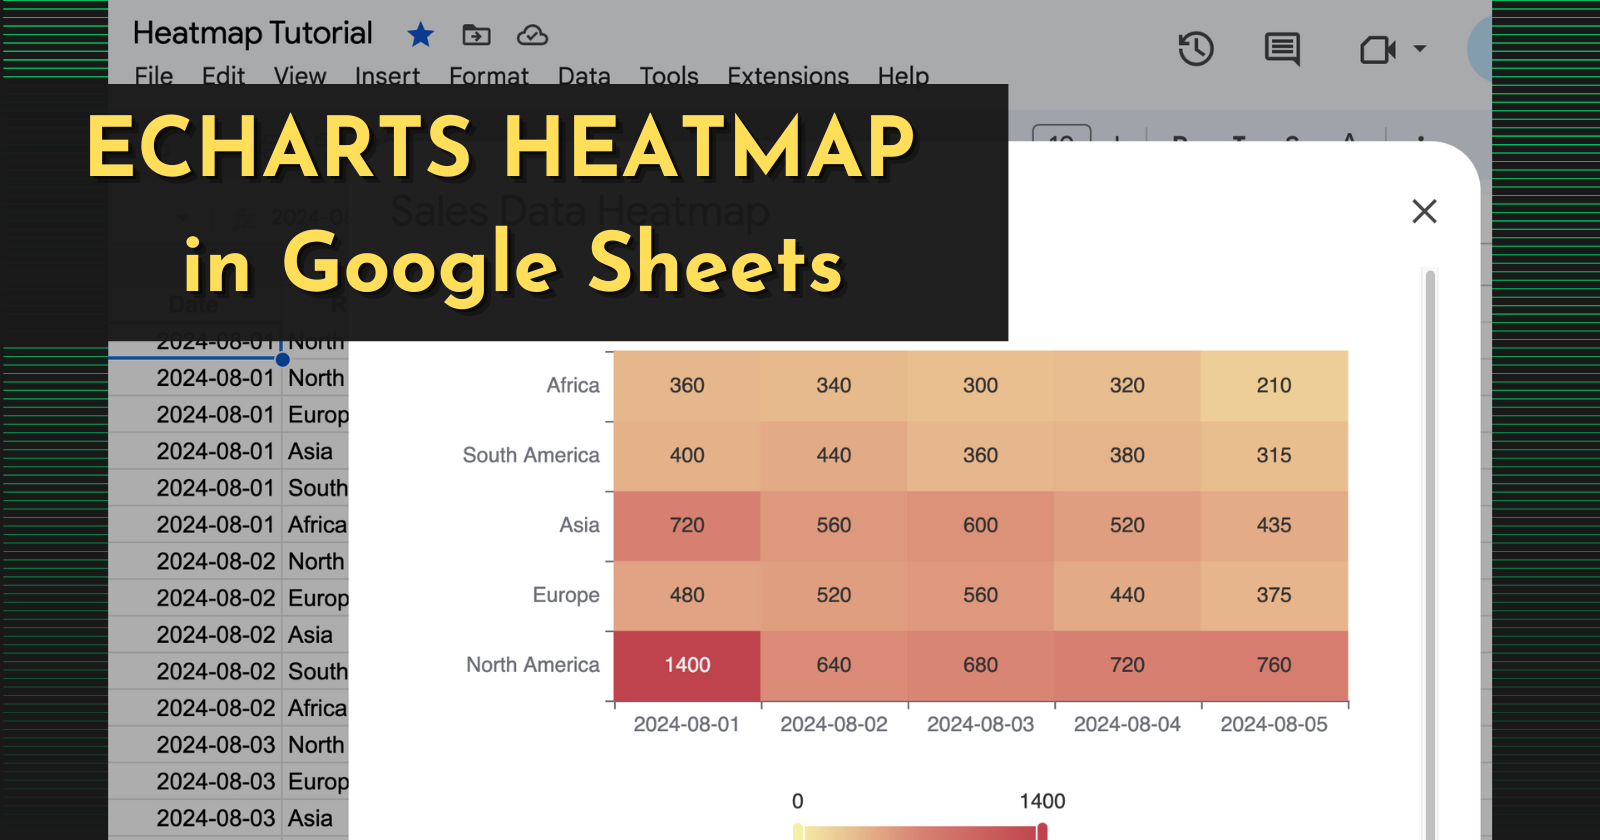
Generating Heatmaps in Google Sheets using Apps Script and ECharts
Heatmaps are a great way to visualize aggregate data so you can easily see trends and spikes in the data. They can summarize data across a range of time, display traffic and weather patterns, or any other series of data comparing two axis. One popula...
blog.greenflux.us8 min read