Forums
Thread
D3 awesomeness - What have you created with it?
D3 is one of the most popular JavaScript library for creating complex charts and data analysis tools. Have you ever created something with it? or have you come across something cool made with D3? Please share them here! :)
Responses(3)
Not yet no, I was considering it, but for simpler charts ChartJS looks as an more easy approach. I would like a Vue extension to D3 :-)
Bit of genetics, I wrote a circular vis tool with 3d renderer in SVG:
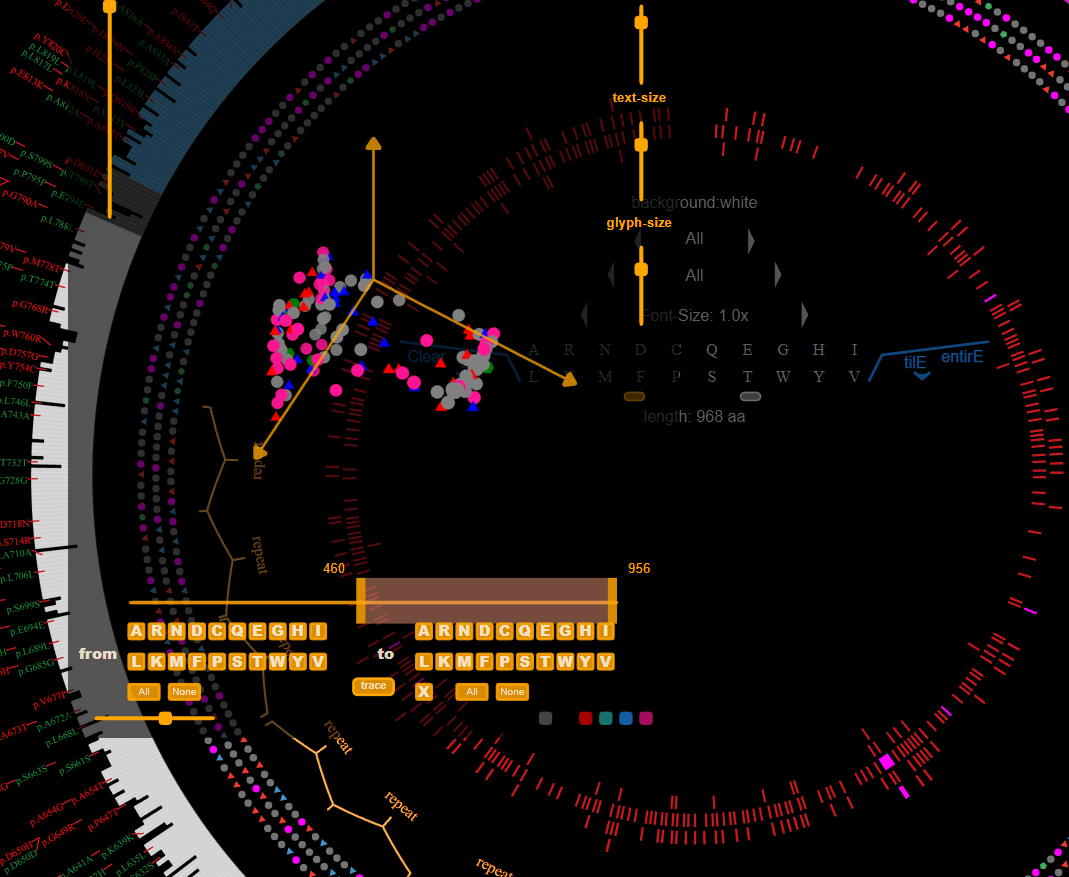
Here is the white paper if you are interested
It's not the Driest code you know :) It is a 5 yo project that combines perl + javascript + HTML + D3 but still looks decent among its rivals.
If you are interested let me know, I can post more examples.
Sabrina
This is an interesting question. D3 is a very powerful library for making complex charts. One of my favorite charts made using D3 is this 2013 budget chart created by the New York times team.
A Christmas Carol chart is also one of my favorite charts.
I have personally never created any complex charts using D3. I am still learning it. 😀 Looking forward to making one soon.